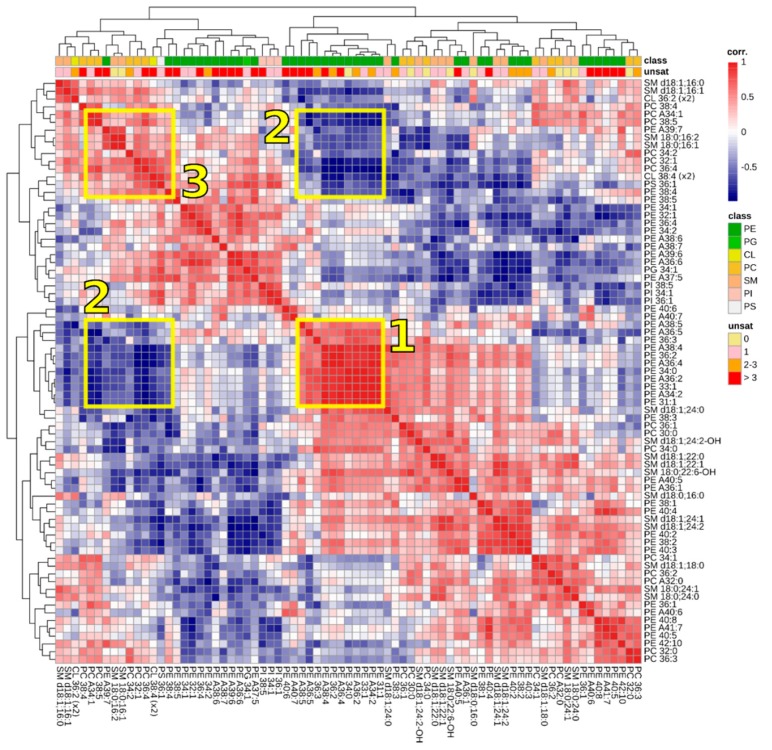
Figure 4.
Heatmap of lipid-lipid correlations. The 75 most abundant lipid signals were ordered using hierarchical clustering. Correlations between lipid species are colored from strong positive correlation (red), to no correlation (white), to negative correlation (blue). The boxed areas 1–3 are discussed in the main text.

