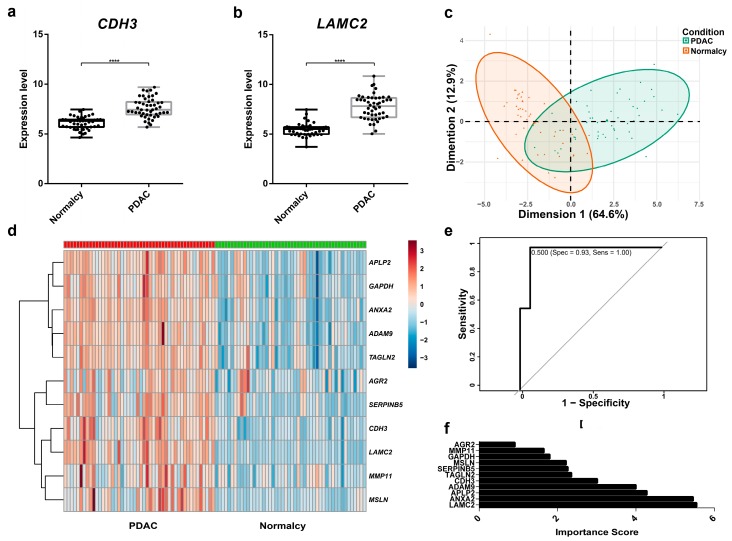
Figure 3.
Data exploration and diagnostic performance of 11 biomarker candidates in the Random Forests model. (a) The gene expression of CDH3 is higher in PDAC than in normal controls (n = 96), ****: p < 0.0001. (b) The gene expression of LAMC2 is higher in PDAC than in normal controls (n = 96). (c) Principal component analysis of PDAC versus normal controls. (d) Heatmap analysis of 11 biomarker candidates. (e) ROC curve of the random forests model in the test set (n = 28). (f) The importance scores of 11 biomarker candidates in the random forests model.

