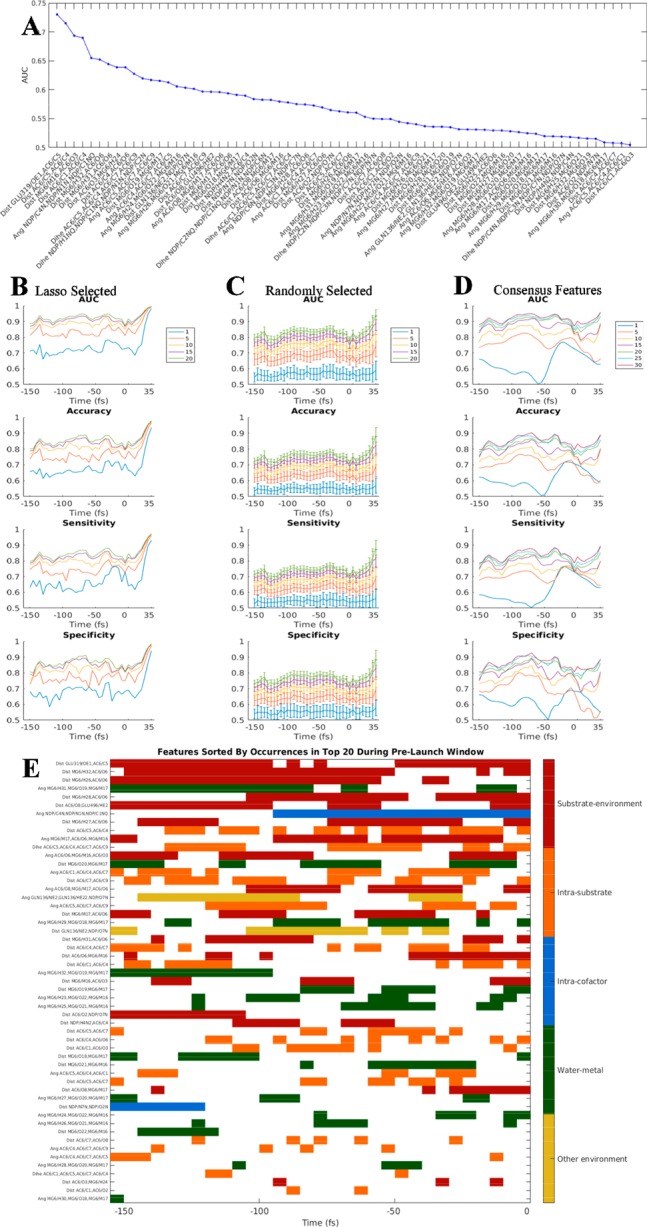
Figure 2.

(A) AUC performance for all 68 individual features at the 0-fs time point. Values of AUC shown represent the mean computed across five equal cross-validation training and testing partitions. (B) AUC, accuracy, sensitivity, and specificity for models with LASSO-selected features. (C) AUC, accuracy, sensitivity, and specificity are plotted for models with randomly selected features. (D) AUC, accuracy, sensitivity, and specificity are plotted for models with 30 consensus features. Error bars in (C) correspond to standard error of the mean across 100 randomly selected feature sets. (E) Top 20 features selected by LASSO at each time point. Features are colored by feature type and sorted by the total number of occurrences in the top 20 between −150 and 0 fs.
