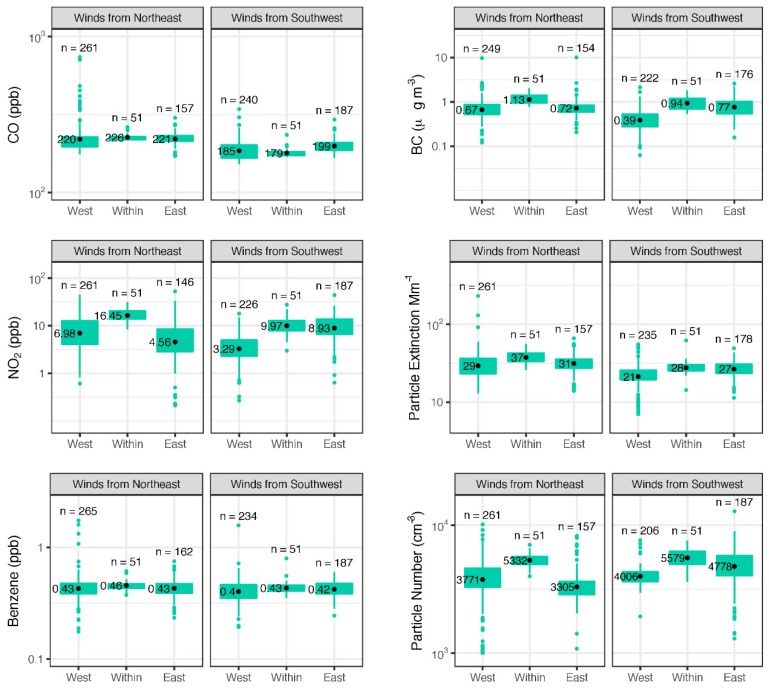
Figure 5.
Concentration geometric means (black points) and box-and-whisker plots for concentrations aggregated by 50 m road segment and hour on road segments representing upwind, within, and downwind of the rail yard during cross-wind conditions. Boxes represent 25th and 75th quantiles, outlier points are measurements greater than 1.5 times the interquartile range away from the edge of the box. All measurements are plotted on a log-scale.

