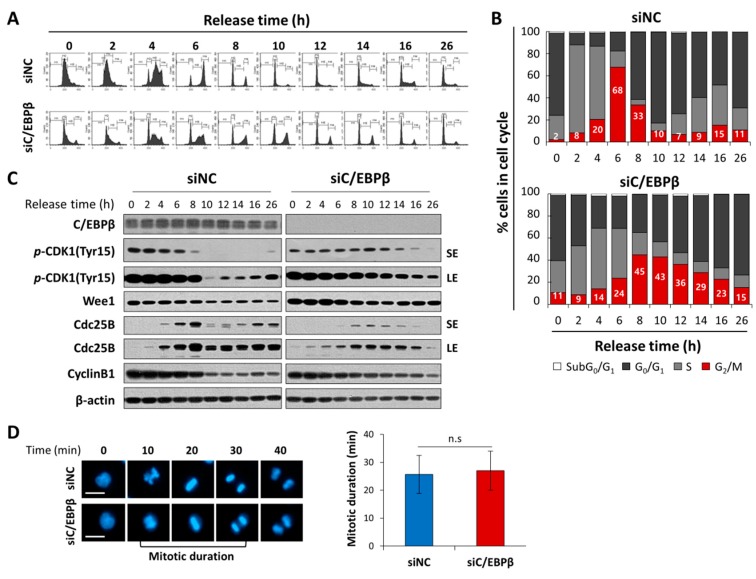
Figure 4.
C/EBPβ knockdown delays G2/M-cell cycle transition. (A) A time course study of the cell cycle analysis was performed in control or C/EBPβ-knockdown A549 cells. Cells were released from thymidine double block-induced G1/S synchronization; and 0, 2, 4, 6, 8, 10, 12, 14, 16, and 26 h after releasing, cells were collected and stained with PI to measure DNA content using FACS. (B) The data are expressed as the percentage of cells in the subG0/G1, G0/G1, S, and G2/M phase at the indicated time points. (C) Whole cell lysates were prepared at the indicated times and Western blot analysis was performed for expression of proteins associated with the G2/M transition (Y15-pCDK1, Wee1, Cdc25B and Cyclin B1). SE; short exposure, LE; long exposure. (D) Mitotic duration of control or C/EBPβ-knockdown A549 cells stained with NucBlue® was monitored by an Operetta High Content Screening (HCS) System. Representative images of siNC and siC/EBPβ-transfected cells from time lapse series were shown. Images were acquired every 10 min. Data are presented as mean ± SD of mitotic duration in 30 cells in each group. Mitotic duration was measured from nuclear envelope breakdown (prometaphase) to anaphase onsets [52]. Statistical significance was determined using the t-test; n.s., not significant. Cell images were taken at a magnification of 200X using an Operetta High Content Screening (HCS) System. Scale bar: 20 μm.

