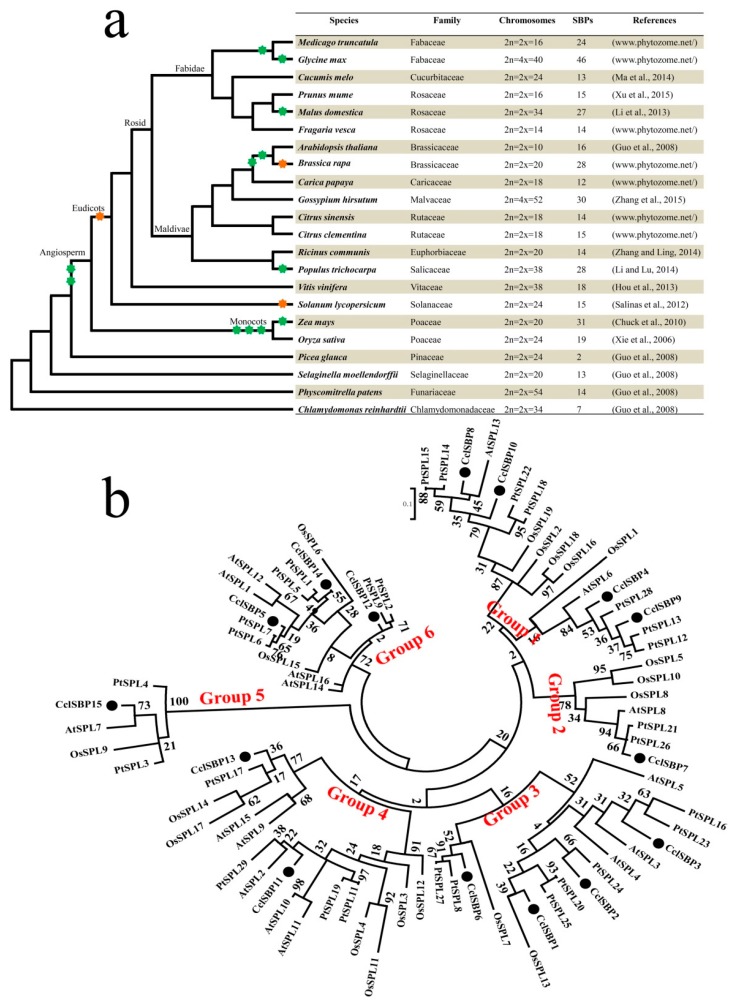
Figure 3.
Comparative and phylogenetic analysis of the SBP genes in various plants. (a) The species tree and number of SBP-box paralogs in each species. The species tree and the duplication events are based on information in phytozome and plant genome duplication database (PGDD). The green star represents whole genome duplication and the yellow star represents whole genome triplication, respectively. Branch lengths do not represent time or the relative amount of character change; (b) phylogenetic analysis of citrus and other plant SBP-box genes. Phylogenetic tree was constructed using SBP domain protein sequences from citrus, Populus (PtSPLs), Arabidopsis (AtSPLs), and rice (OsSPLs), using MEGA 6.0 software [38].

