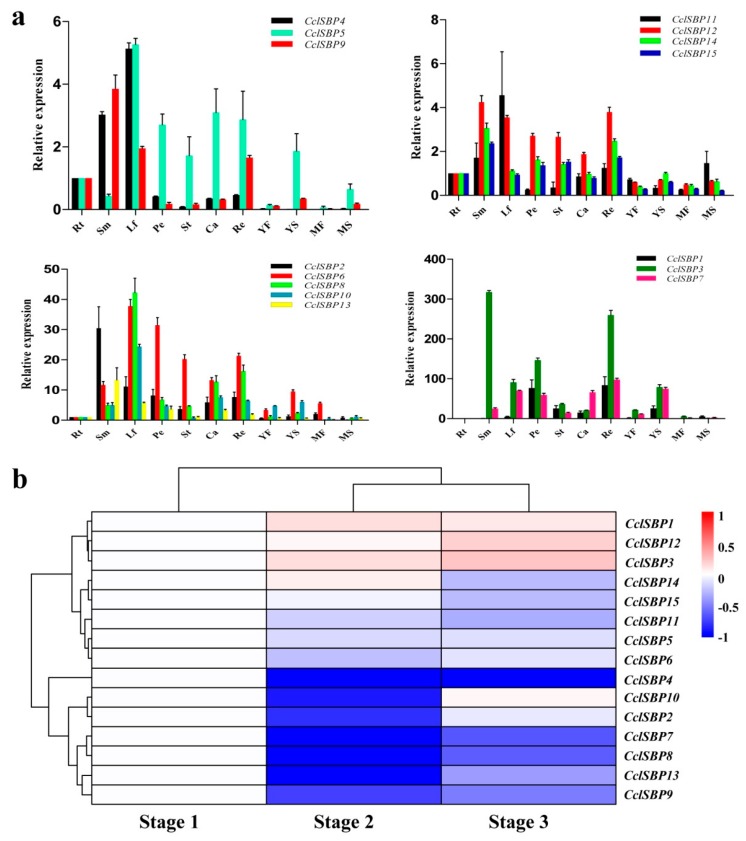
Figure 5.
Analysis of the expression patterns of the CclSBPs gene family. (a) Relative quantities of CclSBPs in various tissues. Fold changes of the transcript levels in the root (Rt), stem (Sm), leaf (Lf), petal (Pe), stamen (St), carpel (Ca), receptacle (Re), young fruits (YF), young seeds (YS), mature fruits (MF), mature seeds (MS) of citrus are shown. Error bars represent the standard deviations of mean value from at least three biological replicates. (b) Cluster analysis of the expression profiles of CclSBPs at three stages (stage 1: one week before water deficit; stage 2: one week after the beginning of water deficit; and stage 3: one week after release from the water deficit), as shown in a previous study [32]. Each column represents a sample, and each row represents a single citrus transcript sequence. The bar represented the scale of relative expression levels of differentially expressed genes (DEGs), and the colors indicate relative signal intensities.

