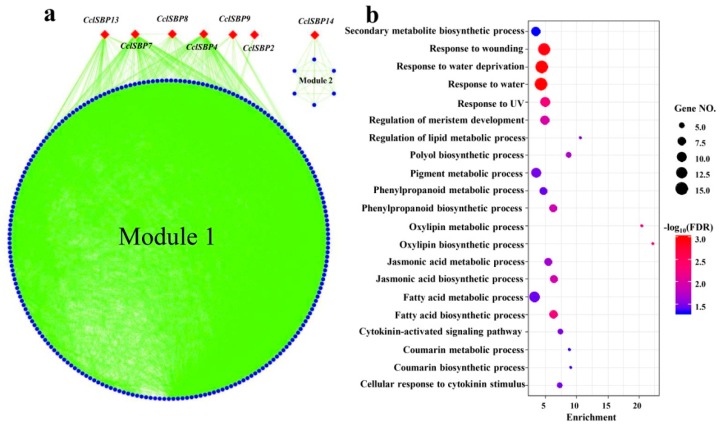
Figure 6.
Co-expression network analysis of the CclSBPs using the data from a previous study [32]. (a) CclSBPs centered the gene co-expression network under floral inductive water deficit conditions. (b) The biological processes of the GO term that were significantly enriched in the CsSBP centered network.

