Fig. 3.
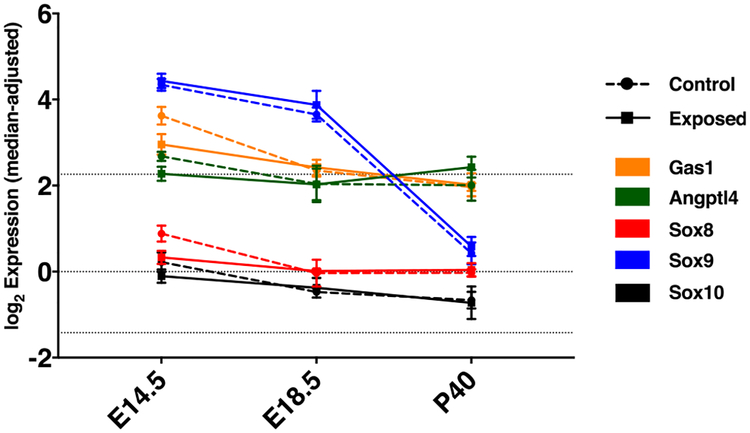
Median-adjusted and log2-transformed expression (transcription microarray) of Gas1, Angptl4 and Sox 8 as well as the SoxE family members Sox9 and Sox10 in lungs of CAP-exposed and control mice. Error bars show SD, dotted lines represent quartiles of the overall distribution of expression values in the experiment.

