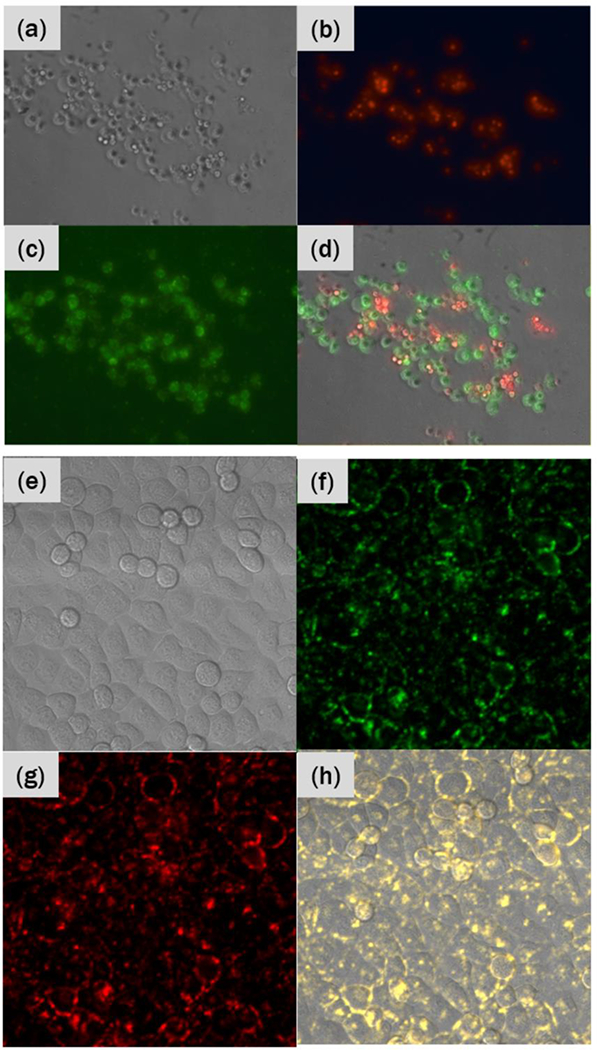
FIGURE 2.

(a) Brightfield image of a mixture of A549 (EGFR-positive) and H520 (EGFRnegative) cells. (b) Red fluorescence image showing luminescence from the nuclei of H520 cells and (c) green fluorescence image showing luminescence from the C-225 antibodies conjugated on UCNP-AuNR nanoclusters. (d) An overlay of both fluorescence images with the brightfield image. (e) Brightfield image of T24T cells conjugated with UCNP-AuNR nanoclusters. Confocal mapping of PL signal upon 980nm excitation in (f) green and (g) red. (h) An overlay of green and red PL maps with the brightfield image shows membrane binding, with yellow representing dual green and red detection.
