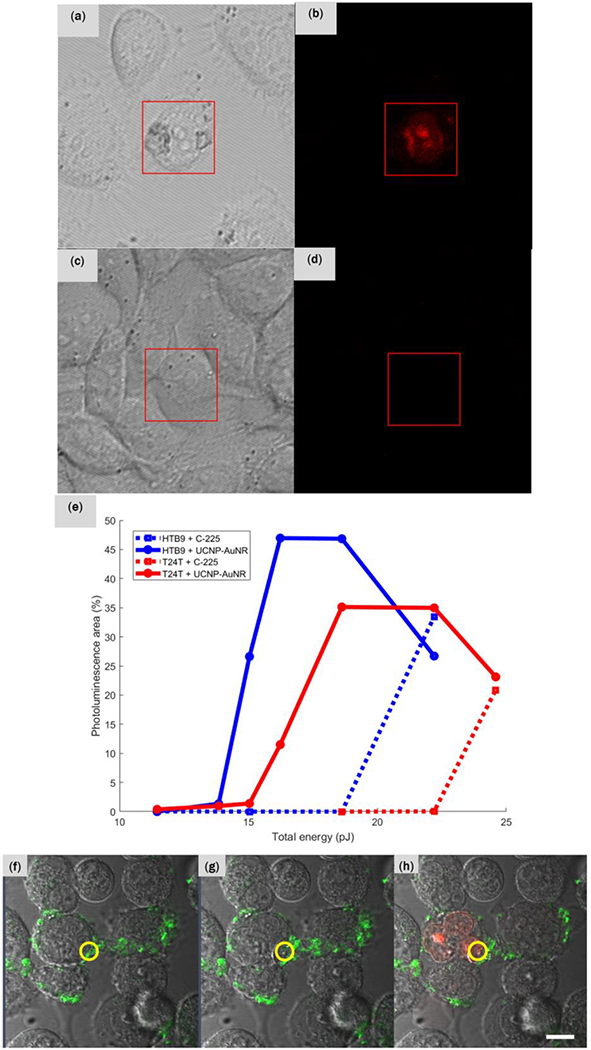
FIGURE 4.

(a) Brightfield and (b) corresponding red fluorescence micrograph of HTB9 cells bound with UCNP-AuNR nanoclusters. (c) Brightfield and (d) corresponding red fluorescence micrographs of HTB9 cells without the nanoclusters. Both sets of samples have been irradiated with identical dosage of fs laser and all images were acquired 5 min after irradiation. (e) Quantification of percentages of pixel exhibiting red fluorescence in both HTB9 and T24T cells with and without UCNP-AuNR conjugation with respect to total energy delivered to the cells. (f) T24T cells bound with UCNP-AuNR nanoclusters. Green signal is the upconverted PL from the UCNPs present on the cell membrane. The irradiation occurred only within the red circular region. (g) T24T cells immediately after the fs pulse irradiation shows membrane disruption and cell enlargement (time lapse video is also available), and (h) 16 min after the fs pulse irradiation, red fluorescence was visible within the cell nuclei indicating that the PI dye penetrated through the porated cell membrane and reacted with RNA within the nuclei. The scale bar indicates 10 μm.
