
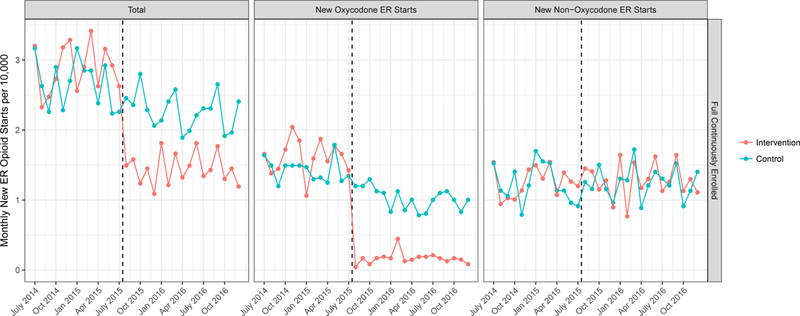
Exhibit 2: Unadjusted Trends in New Extended Release Opioid Starts Relative to Implementation of Prior Authorization.
Source: Authors’ analysis of Blue Shield of California and Truven MarketScan databases, 2014–2016.
Notes: Unadjusted trends in monthly new extended release opioid fill rates per 10,000 persons divided into all ER opioids (right panel), oxycodone ER opioids (center panel) and non-oxycodone ER opioids (right panel). “New” prescribing is defined as a new fill among those without any opioid use in the prior 6 months. Trends are shown for the intervention population (Blue Shield of California, orange line) and the control population (MarketScan, blue line). The dashed black line indicates the time of oxycodone ER prior authorization implementation, July 2015. ER is extended release.