Figure 4.

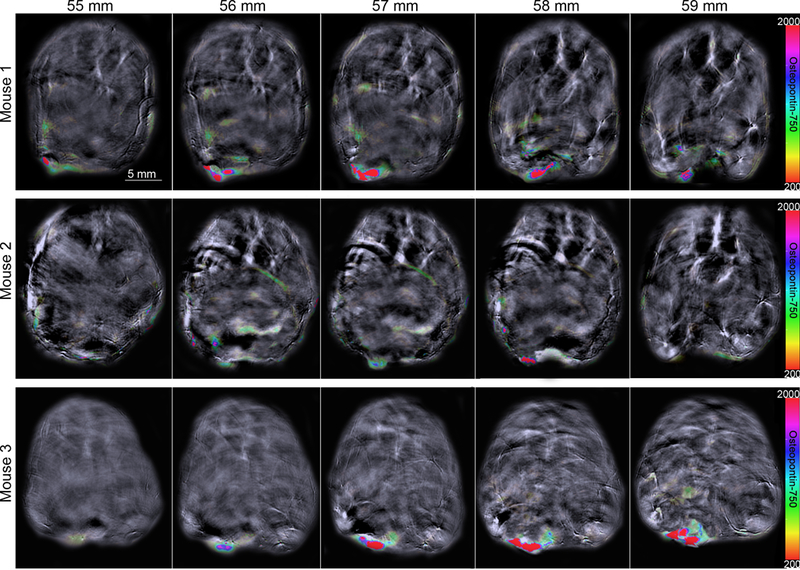
MSOT in vivo. Accumulation of osteopontin-750 was observed using the rainbow color bar. Background image is shown using 900 nm single wavelength. Images for three mice.

MSOT in vivo. Accumulation of osteopontin-750 was observed using the rainbow color bar. Background image is shown using 900 nm single wavelength. Images for three mice.