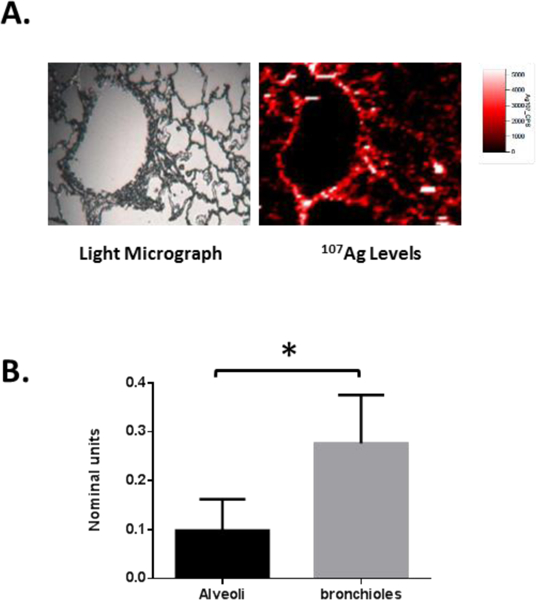
Figure 3: Analysis of 107Ag levels with rat lung after AgNP exposure.

After AgNP exposure, lung tissue was fixed and processed for laser ablation ICP-MS assessment of 107Ag levels. Representative light microscopy image (A; left panel) and associated map of spatial distribution of 107Ag (A; right panel) for the distal lung. Quantification of airway wall 107Ag as a proportion of 13C content was carried out for both bronchiolar and alveolar structures for 4 separate airway structure types in each animal (n=3 animals) (B). Results are expressed as mean ± SEM normalised units and statistical analysis performed by t-test (* p<0.05).
