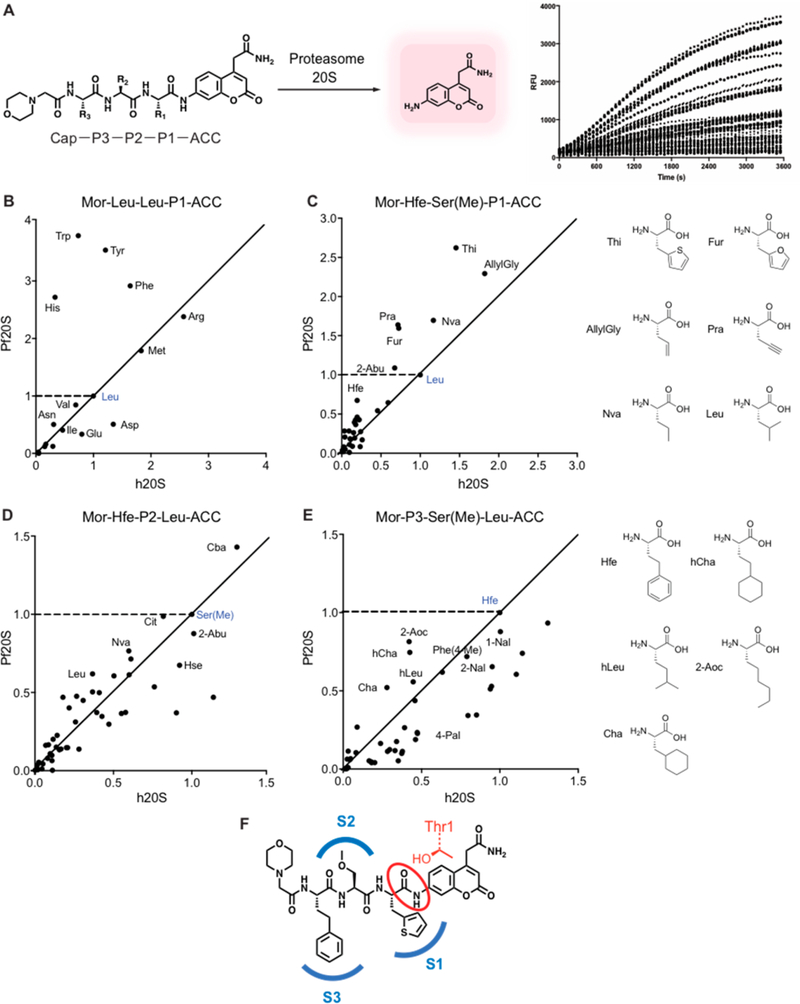
Figure 2.
Profiling the substrate specificity of the P. falciparum 20S proteasome using fluorogenic substrate libraries. (A) Schematic of coumarin-based fluorogenic substrate libraries containing non-natural amino acids at each of the P1, P2, and P3 positions showing processing by the protease to produce a fluorescent signal. (B) Plot of the slope over the linear range of the reaction (RFU/s) of each substrate containing the indicated P1 amino acid residue for the human proteasome (X-axis) and P. falciparum proteasome (Y-axis) normalized to the control substrate containing a P1 leucine (shown in blue). The points above the dashed line represent the P1 substrates with increased activity for the P. falciparum proteasome compared to the control substrate. The closer the points are to Y axis from the diagonal line, the more specific the substrate is for the P. falciparum proteasome over the human proteasome compared to the control substrate. (C–E) Plots as in (B) of the substrate processing rate for each of the P1, P2, and P3 positional scanning libraries containing non-natural amino acids compared to the template substrate Mor-Hfe-Ser(Me)-Leu-ACC (blue points). For each of the P1 (C), P2 (D), and P3 (E) positions, 45–50 non-natural amino acids were tested, while keeping the other positions fixed with the corresponding amino acids in the template sequence as indicated. The RFU/s values of each substrate for human and P. falciparum proteasome 20S were normalized to the values of a control Mor-Hfe-Ser(Me)-Leu-ACC. All experiments were performed at least in triplicate. (F) Structure of the optimal combination of residues found in the substrate profiling, Mor-Hfe-Ser(Me)-Thi-ACC. Mor = morpholinoacetyl, Hfe= homophenylalanine, Ser(Me) = methylserine, Thi = 2-thienylalanine, RFU = relative fluorescence unit.

