. Author manuscript; available in PMC: 2019 Sep 12.
Published in final edited form as: J Am Chem Soc. 2018 Aug 29;140(36):11424–11437. doi: 10.1021/jacs.8b06656

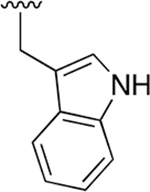
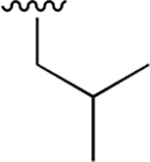
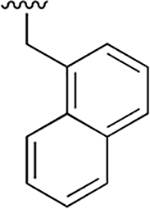
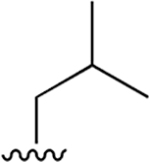
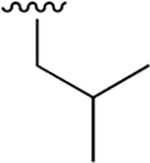
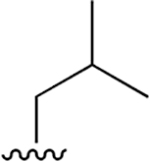
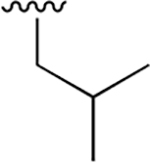
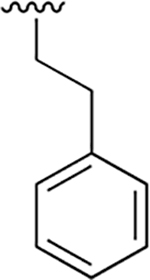
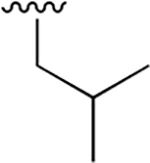
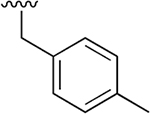
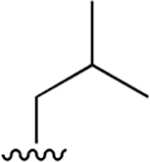
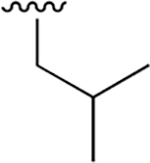
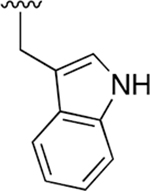
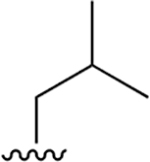
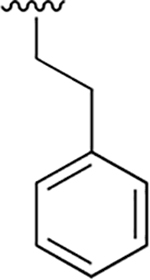
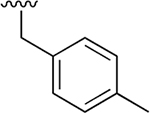
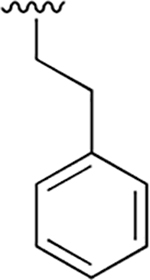
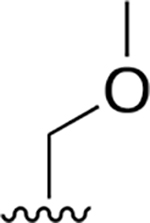
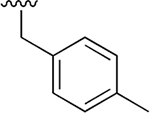
Table 1.

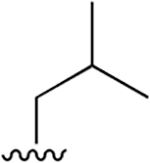
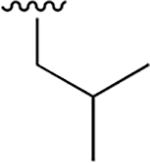
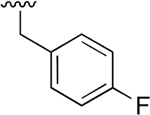
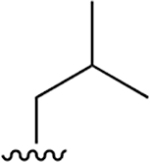
Potency and Selectivity of P1 and P3 Bulky Aromatic VS Inhibitorsa,b

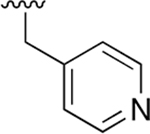
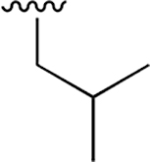
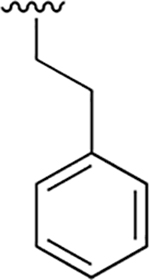
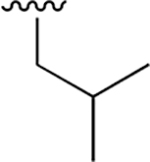
graphic file with name nihms-1003530-t0007.jpg
No. Cap R3 R2 R1 72 h EC50 (μM) 1 h EC50 (μM)
Pf HFF SI Pf HFF SI
WLL -vs graphic file with name nihms-1003530-t0008.jpg graphic file with name nihms-1003530-t0009.jpg graphic file with name nihms-1003530-t0010.jpg graphic file with name nihms-1003530-t0011.jpg 0.015 ± 0.005 1.52 ±0.41 101 0.147 ± 0.009 65.50 ± 15.2 446
1 graphic file with name nihms-1003530-t0012.jpg graphic file with name nihms-1003530-t0013.jpg graphic file with name nihms-1003530-t0014.jpg graphic file with name nihms-1003530-t0015.jpg 0.010 ± 0.002 1.80 ±0.39 178 0.061 ±0.011 nd nd
2 graphic file with name nihms-1003530-t0016.jpg graphic file with name nihms-1003530-t0017.jpg graphic file with name nihms-1003530-t0018.jpg graphic file with name nihms-1003530-t0019.jpg 0.090 ±0.016 1.67 ±0.26 19 0.495 ± 0.058 nd nd
3 graphic file with name nihms-1003530-t0020.jpg graphic file with name nihms-1003530-t0021.jpg graphic file with name nihms-1003530-t0022.jpg graphic file with name nihms-1003530-t0023.jpg 0.003 ± 0.0006 1.88 ±0.46 570 0.048 ± 0.006 75.65 ± 12.68 1576
4 graphic file with name nihms-1003530-t0024.jpg graphic file with name nihms-1003530-t0025.jpg graphic file with name nihms-1003530-t0026.jpg graphic file with name nihms-1003530-t0027.jpg 0.191 ± 0.036 1.67 ±0.32 9 6.27 ±2.64 135 ±42.2 21.5
5 graphic file with name nihms-1003530-t0028.jpg graphic file with name nihms-1003530-t0029.jpg graphic file with name nihms-1003530-t0030.jpg graphic file with name nihms-1003530-t0031.jpg 0.062 ±0.013 1.01 ±0.16 16 2.03 ±0.34 nd nd
6 graphic file with name nihms-1003530-t0032.jpg graphic file with name nihms-1003530-t0033.jpg graphic file with name nihms-1003530-t0034.jpg graphic file with name nihms-1003530-t0035.jpg 1.207 ± 0.093 > 100 nd nd nd
7 graphic file with name nihms-1003530-t0036.jpg graphic file with name nihms-1003530-t0037.jpg graphic file with name nihms-1003530-t0038.jpg graphic file with name nihms-1003530-t0039.jpg 0.022 ± 0.005 13.38 ±4.41 600 0.32 ± 0.035 >250
8 graphic file with name nihms-1003530-t0040.jpg graphic file with name nihms-1003530-t0041.jpg graphic file with name nihms-1003530-t0042.jpg graphic file with name nihms-1003530-t0043.jpg 0.015 ± 0.002 2.08 ±0.46 138 0.091 ± 0.028 nd nd
9 graphic file with name nihms-1003530-t0044.jpg graphic file with name nihms-1003530-t0045.jpg graphic file with name nihms-1003530-t0046.jpg graphic file with name nihms-1003530-t0047.jpg 0.002 ± 0.0002 0.31 ± 0.098 172 0.008 ± 0.002 11.4 ±2.2 1443
10 graphic file with name nihms-1003530-t0048.jpg graphic file with name nihms-1003530-t0049.jpg graphic file with name nihms-1003530-t0050.jpg graphic file with name nihms-1003530-t0051.jpg 0.009 ± 0.002 4.36 ± 1.04 464 0.081 ±0.013 124 ±42.3 1536
graphic file with name nihms-1003530-t0052.jpg 0.030 ± 0.008 2.75 ±0.50 92 0.342 ± 0.074 >50
a

EC50 values for each of the inhibitors 1–10 and the Carmaphycin B analog in 72 and 1 h treatment of P. falciparum W2 at ring stage parasites and non-confluent HFFs.

b

SI, selectivity index; nd, not determined.