Table 2.
 | ||||||||||
|---|---|---|---|---|---|---|---|---|---|---|
| No. | Cap | R3 | R2 | R1 | 72 h EC50 (μM) | 1 h EC50 (μM) | ||||
| Pf | HFF | SI | Pf | HFF | SI | |||||
| 11 |  |
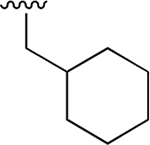 |
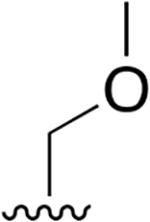 |
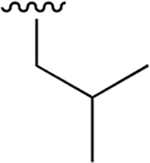 |
0.359 ± 0.042 | 78.41 ± 18.01 | 218 | nd | nd | nd |
| 12 |  |
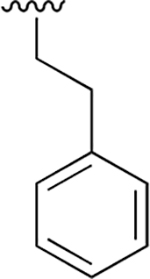 |
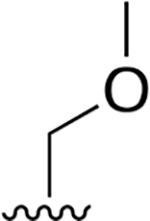 |
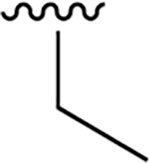 |
0.021 ±0.005 | 13.96 ±3.58 | 652 | 1.013 ±0.169 | >250 | |
| 13 |  |
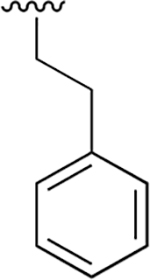 |
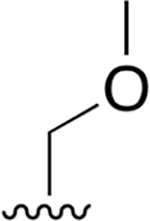 |
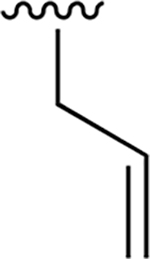 |
0.018 ±0.005 | 8.54 ±2.00 | 482 | 0.33 ± 0.047 | >250 | |
| 14 |  |
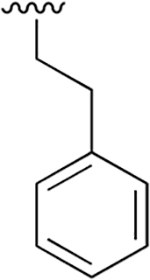 |
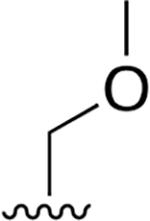 |
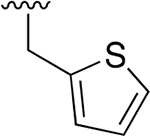 |
0.008 ± 0.002 | 9.80 ±2.96 | 1240 | 0.137 ± 0.095 | >250 | |
| 15 |  |
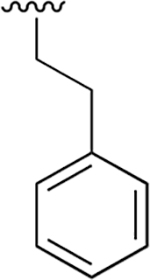 |
 |
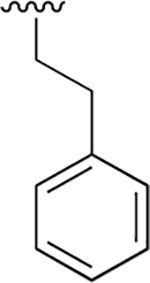 |
0.035 ±0.009 | 15.77 ±3.51 | 445 | 8.03 ±1.33 | >250 | |
| 16 |  |
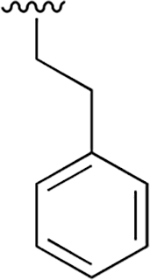 |
 |
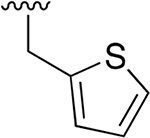 |
0.007 ±0.002 | 7.4 ±1.50 | 1138 | 0.051 ± 0.006 | 207 ±23.2 | 4043 |
| 17 |  |
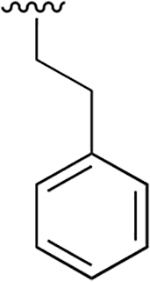 |
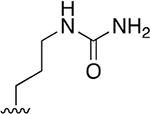 |
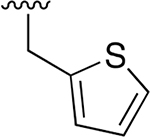 |
0.369 ±0.125 | 246 ±49.63 | 667 | >2.5 | >250 | |
EC50 values for inhibitors 11–17 in 72 and 1 h treatment of P. falciparum W2 at ring stage parasites and non-confluent HFFs.
SI, selectivity index; nd, not determined.
