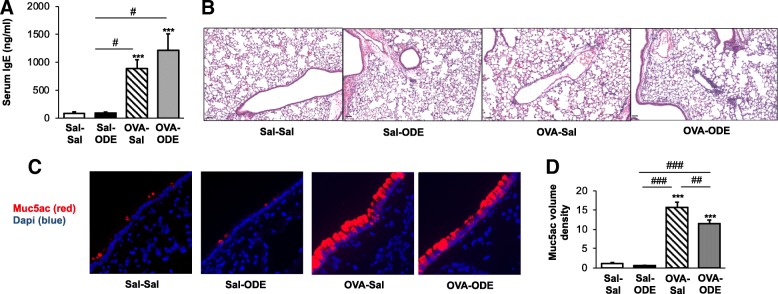
Fig. 3.
Serum IgE levels and lung histopathology from OVA and ODE treated animals. a, Murine serum IgE levels from mice from each treatment group were determined with bar graph represents mean with standard error bars shown. N = 7–8 mice/group from 2 independent experiments. b, A representative murine lung section (hematoxylin and eosin stain, 10X magnification) from each treatment group is shown. Line scale is 60 μm. Note that there is peribronchiolar and perivascular cellular cuffing in OVA and ODE treatment groups. c, Representative images from immunostaining of lung tissues for Muc5ac (UEA1-lectin). Note increased mucin staining in OVA treated groups. d, Bar graph represents mean with standard error bars of Muc5ac volume density as determined by ImageJ software analysis (n = 28–31 images/group from 2 independent experiments). Statistical significance denoted (***p < 0.001) vs. Sal-Sal. Statistical significance denoted (#p < 0.05, ##p < 0.01, ###p < 0.001) as indicate

