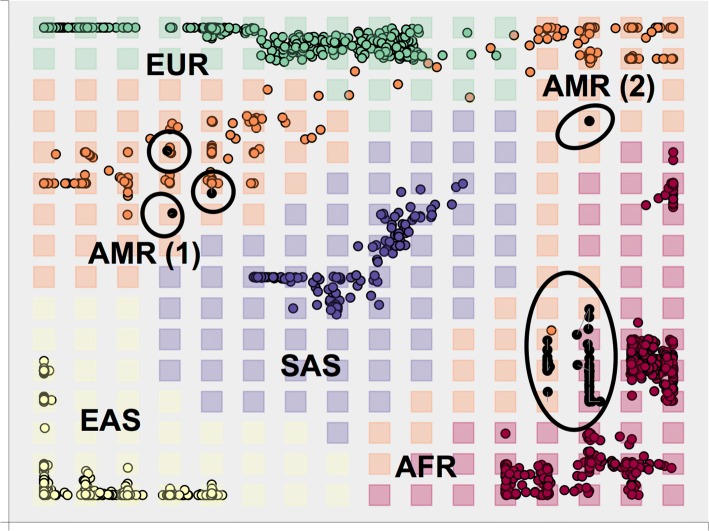
Fig. 5.
Projected Americans of African ancestry in Southwest USA (ASW) on a GTM map. Generative Topographic Map (GTM) trained with 10 principal components. Coloured points represent individuals coloured by ancestry or superpopulation (AFR, AMR, EAS, EUR, SAS). Squares represent GTM nodes coloured by most probable ancestry. The highlighted black points represent mean positions of ASW individuals projected onto the map. Grey lines map mean positions of individuals on the map to their most probable node. Ancestry codes: EAS = East Asians, EUR = Europeans, AFR = Africans, AMR = Admixed Americans, SAS = South Asians

