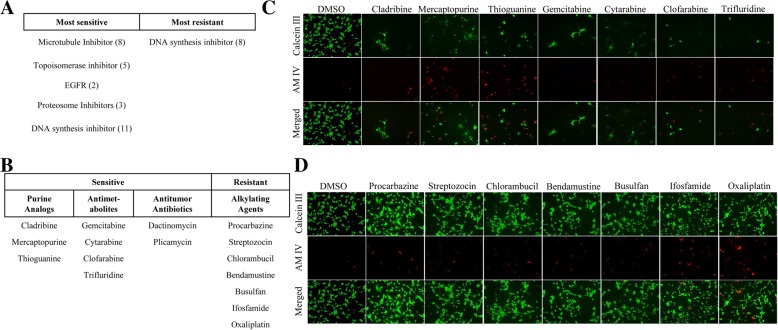
Fig. 3.
TU-BcX-2 K1 adherent cells’ response to NCI drug panel. TU-BcX-2 K1 cells were treated for 72 h with the NCI oncology drug set (1 μM) or DMSO controls. Cells were harvested, stained with Calcein-AM and EthD III and fluorescence used to visualize the live and dead cells. Green = Calcein-AM (live cells), Red = EthD III (dead cells). a Initial observations of imaged TU-BcX-2 K1 cells after treatment showed that TU-BcX-2 K1 cells were most sensitive to compounds targeting microtubules, topoisomerases, proteasomes, EGFR and DNA synthesis inhibitors. TU-BcX-2 K1 cells were most resistant to a subset of DNA synthesis inhibitors. Drugs that were considered to have the ‘most sensitive’ effect on TU-BcX-2 K1 cells resulted in either no cells remaining after treatment, or all dead stained cells. Drugs that were considered to have the ‘most resistant’ effect on TU-BcX-2 K1 cells resulted in all viable (green) cells after treatment. b Among the most effective DNA synthesis inhibitors, TU-BcX-2 K1 cells were sensitive to the specific drug classes: purine analogs, antimetabolites, anticancer antibiotics. TU-BcX-2 K1 cells were most resistant to alkylating agents within the larger classification of DNA synthesis-targeting compounds. c Representative images of purine analogs and antimetabolites to which TU-BcX-2 K1 was most sensitive. d Representative images of alkylating agents that were not effective in TU-BcX-2 K1 cells. Images were captured using fluorescence microscopy and are shown at 100X magnification

