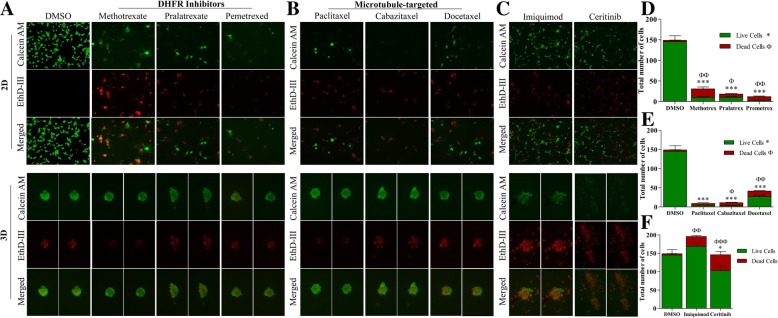
Fig. 5.
Compounds identified from screen that had different chemosensitivity profiles in 2D and 3D culture conditions. TU-BcX-2 K1 cells were plated in 2D and 3D conditions and treated for 72 h with the NCI oncology drug set (1 μM) or DMSO controls. Cells were harvested, stained with Calcein-AM and EthD III and fluorescence used to visualize the live and dead cells. Green = Calcein-AM (live cells), Red = EthD III (dead cells). a Therapies targeting dihydrofolate reductase (a) and microtubules (b) that were efficacious in adherent plated TU-BcX-2 K1 cells but ineffective in 3D conditions. c Small molecule targeted inhibitors that had limited efficacy in 2D/adherent conditions but were efficacious in three-dimensional cell conditions. (D-F) Quantification of live and dead cells from the selected inhibitors in panels (a-c). Data is represented as total number of live compared to total number of dead cells. Significance was obtained by comparing numbers of live and dead cells in the treatment groups to respective DMSO controls. The symbol ‘*’ represents significance for live cell comparisons, and ‘ф’ shows significance for dead cell comparisons. * p < 0.05, ** p < 0.01, *** p < 0.001. All data was obtained after adherent TU-BcX-2 K1 cells were treated and subsequently staining with Calcein-AM to highlight live cells (green) or EthD-III to highlight dead cells (red). Images were captured with fluorescence microscopy and are shown at 100X magnification

