Figure 1.
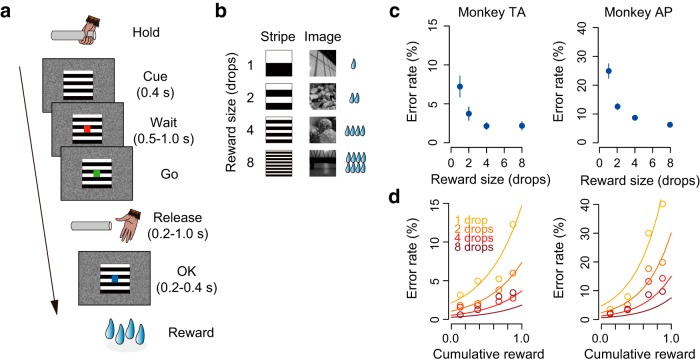
Reward size task and behavioral performance. a, Sequence of a trial. b, Cue stimuli. Either the stripe set (left column) or image set (right column) was used to inform the reward size (1, 2, 4, or 8 drops of liquid). c, Error rate (mean ± SEM) as a function of reward size for monkeys TA and AP. d, Mean error rate as a function of normalized cumulative reward for the two monkeys. Each color indicates reward size. Curves were best fit of Equations 1 and 2 with c = 2.1, λ = 1.9 for monkey TA and c = 4.7, λ = 2.5 for monkey AP.

