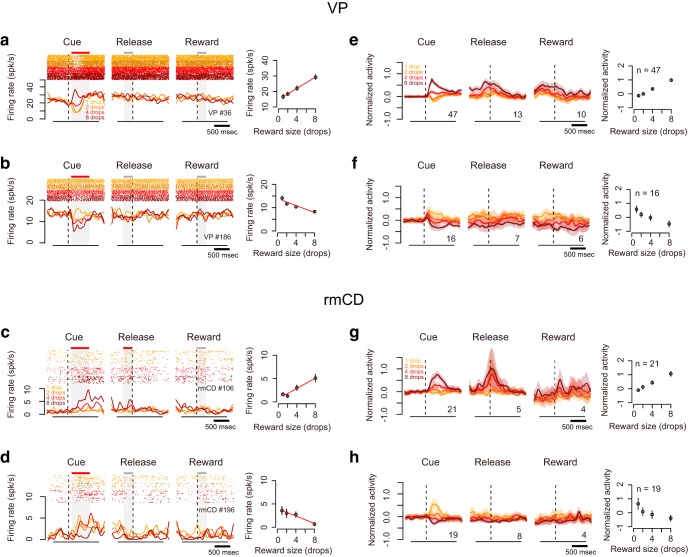
Figure 3.
Reward size coding in VP and rmCD. a, b, Example activity of VP neurons showing positive (a) and negative (b) reward size coding during cue period, respectively. Left, Raster spikes and spike density function (SDF, σ = 10 ms) were aligned at task events. The colors correspond to the respective reward sizes. Red bars above shading indicate significant linear correlation at the task period (p < 0.05, linear regression analysis); gray bars indicate no significant correlation (p > 0.05). Right, Relationship between firing rate (mean ± SEM) during cue period and reward size. Regression lines are shown in red (p < 0.01). c, d, Examples of rmCD neurons. Schema of the figures are the same as in a and b. e, f, Left, Population activities of VP neurons that were classified into positive (e) and negative (f) reward size coding neurons, respectively. Curves and shading indicate mean and SEM of normalized activity to the baseline aligned at task events. Digits in each panel indicate the number of reward size coding neurons at each task period. Right, Relationship between normalized neuronal activity during cue period (mean ± SEM) and reward size. g, h. Population activities of rmCD neurons. Schema of the figures are the same as in e and f.

