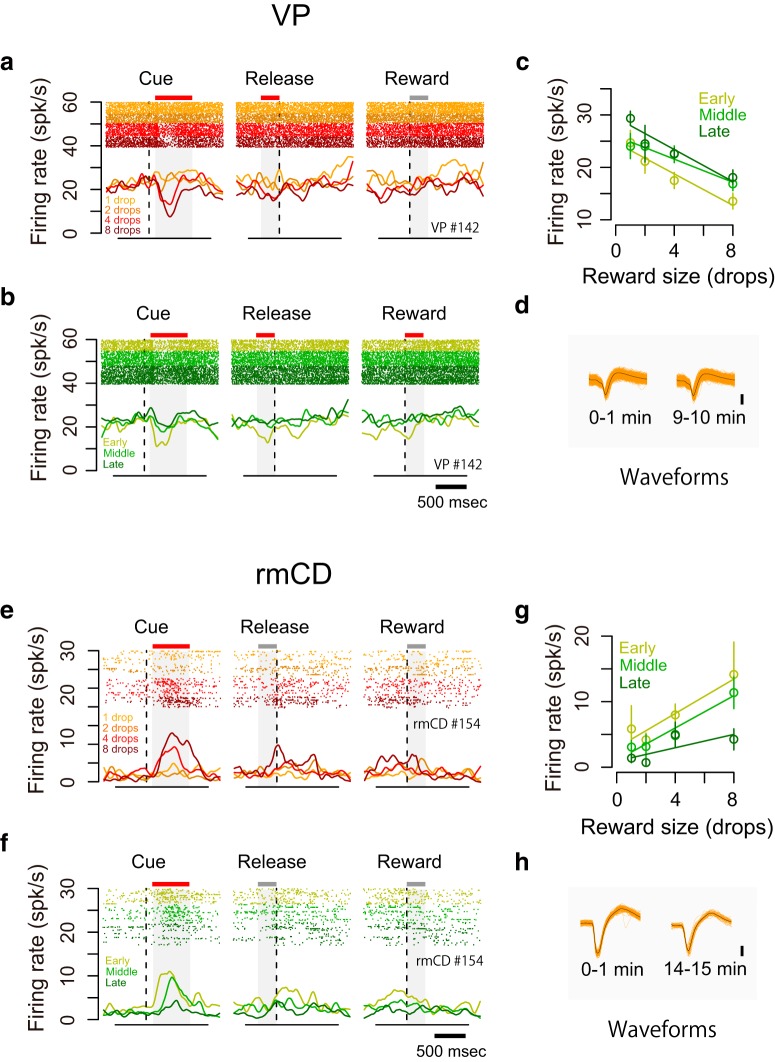
Figure 6.
Dual coding of reward size and satiation level in single neurons. a–d, Example VP neuron showing negative reward size coding and positive satiation level coding. a, b, Raster plots and SDF are shown for each reward condition (a) and for each session period (b). c, Relationship between firing rate during the cue period (mean ± SEM) and reward size are plotted for the session period. Linear regressions are shown as colored lines. d, Waveforms of each spike (orange) and average waveform (black) during the first minute (left) and last minute (right) in the recording session. e–h, Example rmCD neuron showing positive reward size coding and negative satiation level coding. Schema of the figures are the same as in a–d.

