
Figure 5.
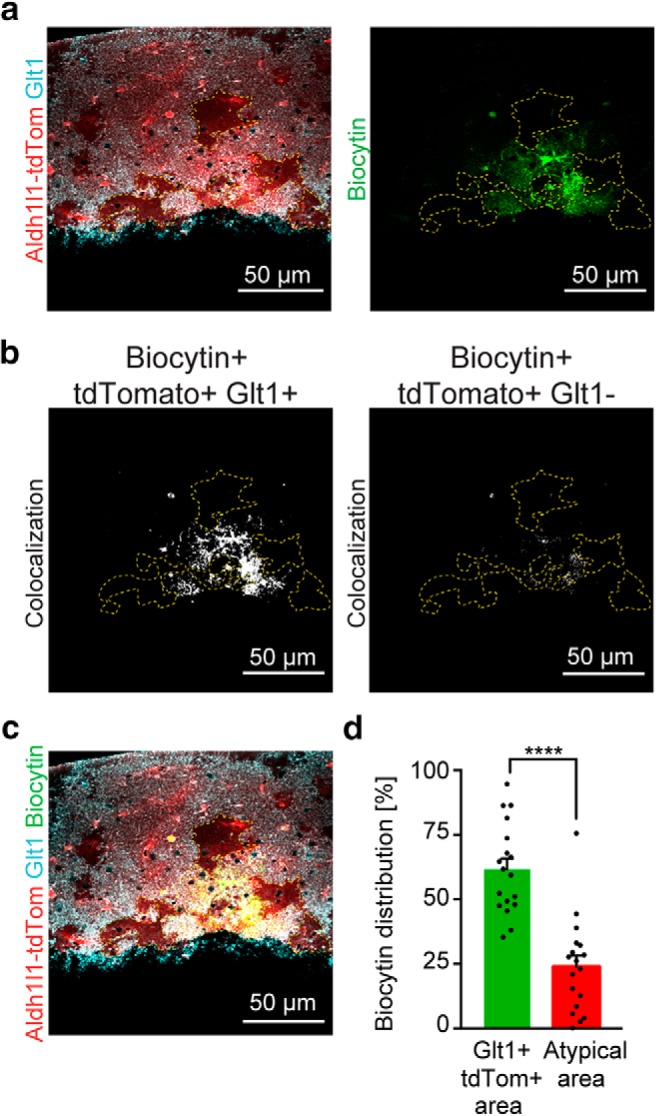
Biocytin is preferentially excluded of areas with atypical astrocytes. a, Confocal image of an acute brain slice that was labeled with Glt1 Aldh1l1-tdTomato following biocytin filling of a single astrocyte using whole-cell patch clamping. Biocytin spreads to neighboring astrocytes through gap junctions. Atypical astrocytes were outlined by a yellow dotted line. b, Binary image showing the biocytin-positive pixels that overlap with Glt-1+ tdTomato+ (left) and with the atypical astrocytes (right). c, Merged image of the tdTomato, Glt1, and biocytin channels. d, Graph showing the distribution of biocytin between the Glt-1+ tdTomato+ area and the atypical area. If biocytin were evenly distributed between atypical areas and TdTom+/Glt1+ area, then each area would have an expected value of 50% biocytin pixels and both areas add to a total value of 100%. See Figure 5-1 for breakdown of sample sizes dependent on sex for representative images and detailed numerical data for all statistical group comparisons. ****p ≤ 0.0001.