
Figure 6.
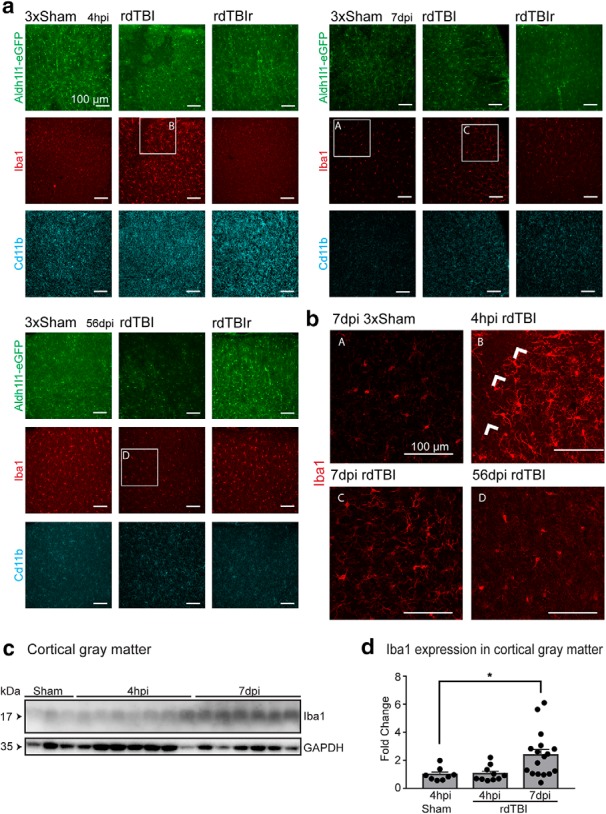
Microglia were mildly activated after rdTBI. a, Confocal images within regions with atypical astrocytes (rdTBI), in regions without atypical astrocytes (rdTBIr), and in matching brain slices from Sham animals after staining for Iba1 and Cd11b showed Iba1 upregulation at 4 hpi and 7 dpi and was resolved at 56 dpi. b, Enlarged images with normal Iba1 expression in 3xSham mouse at 7 dpi (a); enhanced Iba1 levels and thickened processes at 4 hpi (b) and 7 dpi (c), whereas this was resolved at 56 dpi in areas with atypical astrocytes (d). Occasionally, microglia densities appeared reduced in parts of areas with atypical astrocytes (b, arrows). c, Western blots for Iba1 compared expression in female (pictured) and male cortical gray matter across postinjury time points (quantified in d). See Figure 6-1 for breakdown of sample sizes dependent on sex for representative images and detailed numerical data for all statistical group comparisons. *p ≤ 0.05.