Fig. 4.
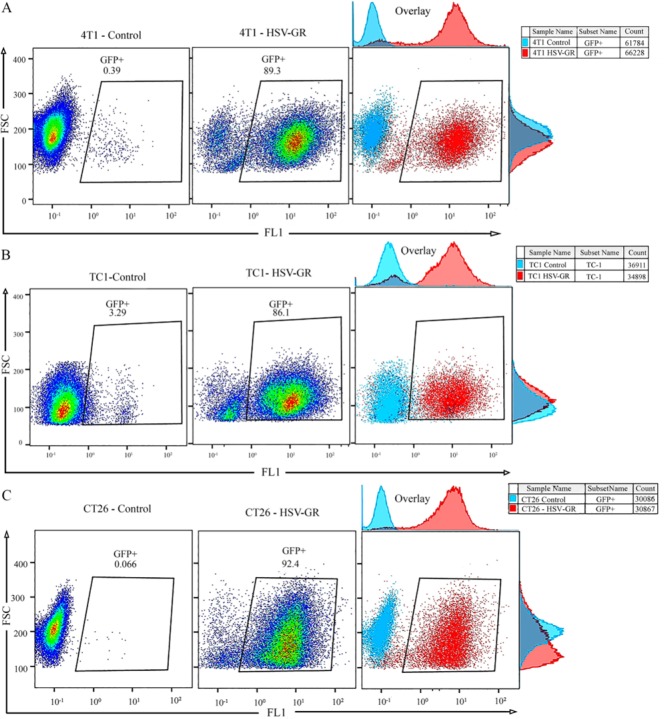
In vitro analysis of the infection potency of herpes simplex virus green-red (HSV-GR) in 4T1, TC-1 and CT26 cells using flow cytometry. HSV-GR was used to infect three mouse tumor cells at the indicated multiplicity of infection (MOIs) and times. Infected cells have been analyzed as described using the flow cytometry. GFP fluorescence signal was gated at FL1 channel to determine infection potency. (A) The representative dot plot demonstrates the GFP expression of HSV-GR infected 4T1 cells at a MOI of 1; 89.3% of infected cells demonstrate GFP expression. (B) Dot plot showing GFP expression coordinates of TC-1 cells infected with HSV-GR at MOI of 1; 86.1 percent of infected cells show GFP expression. (C) The representative dot plot showing GFP expression of CT26 cells infected with HSVGR at MOI of 1; 92.4% of infected cells demonstrate GFP expression.

