Fig. 2.

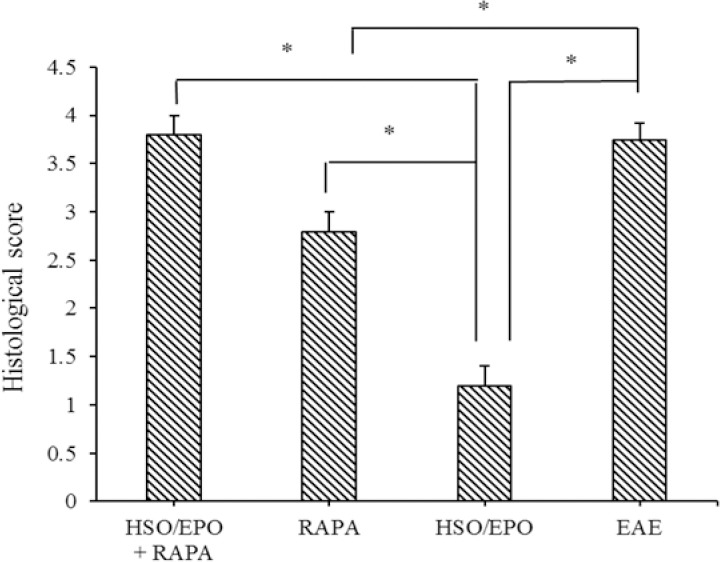
Histological score indicating the degree of inflammation, neuronal and axonal changes and demyelination. Data are presented as mean ± SEM. * Shows significant difference between groups, P ≤ 0.05.

Histological score indicating the degree of inflammation, neuronal and axonal changes and demyelination. Data are presented as mean ± SEM. * Shows significant difference between groups, P ≤ 0.05.