
Fig. 4.
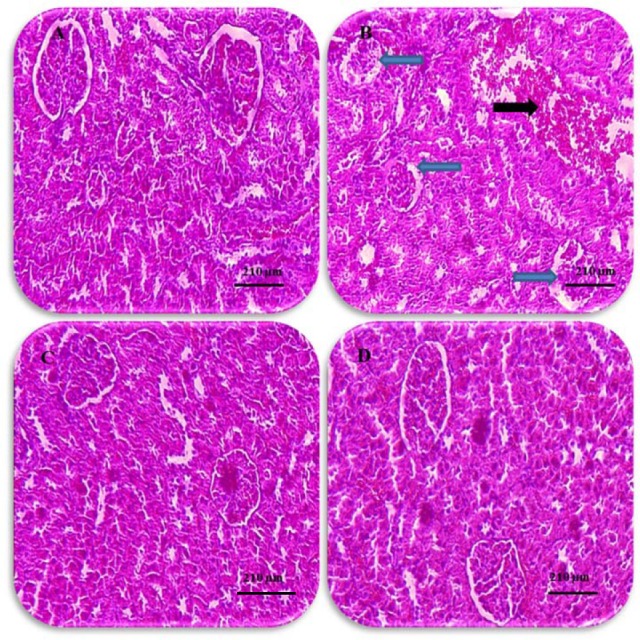
Histological changes in kidneys (hematoxylin-eosin, × 100). (A) Normal kidney, saline group, (B) nitrosamine control group, increased Bowman’s capsule space and glomerular shrinkage (blue arrow) and bleeding in the space between the tubules (black arrow), (C) normal kidney, pentoxifylline 100 mg/kg group showing glomeruli with Bowman’s capsule and distal and proximal tubules, (D) normal kidney structure in nitrosamine + pentoxifylline 100 mg/kg group (scale bars: black = 210 μm).