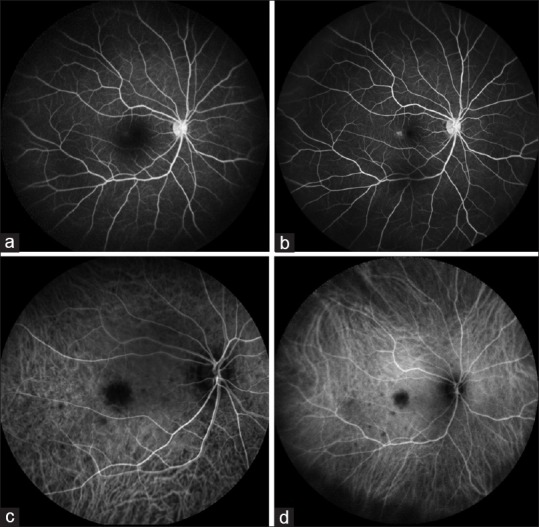
Figure 2.

(a and b) Fundus fluorescein angiography of the right eye showing area of hypofluorescence corresponding to the choroidal tubercle and subsequent hyperfluorescence in late frames of the angiogram. (c and d) Indocyanine green angiography photographs of the right eye showing choroidal nodule as hypocyanescent spot throughout angiogram. Kindly also note the multiple small hypocyanescent lesions seen on indocyanine green angiography
