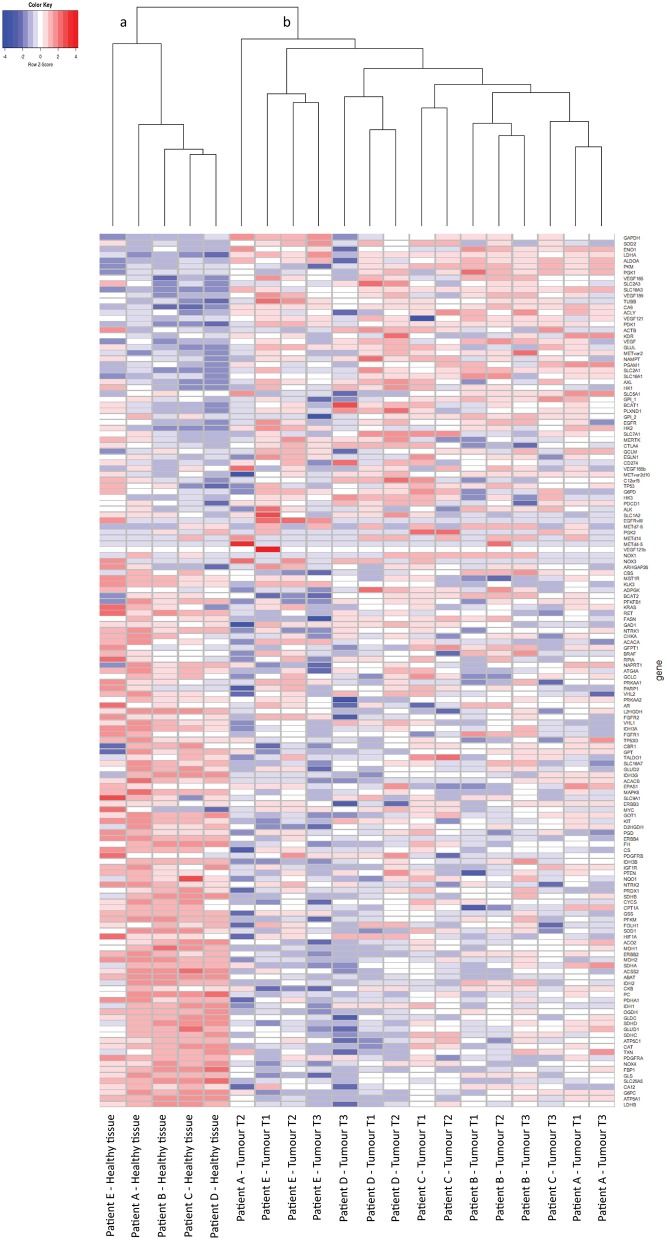
Figure 2.
t/RNA-NGS of ccRCC and healthy kidney tissue. Tissues originate from five ccRCC patients, one healthy-appearing kidney sample and three tumor biopsies each. Heatmap containing 152 genes, generated by unsupervised hierarchical clustering using the Manhattan distance and Average clustering method. Two head clusters are generated: cluster (a) contains all healthy kidney tissues, while cluster (b) consists of the tumor biopsies from all five ccRCC patients. The three tumor biopsies from patients B, D, and E cluster together in a subcluster, while patients A and C both have one tumor sample that groups separately from the other two.

