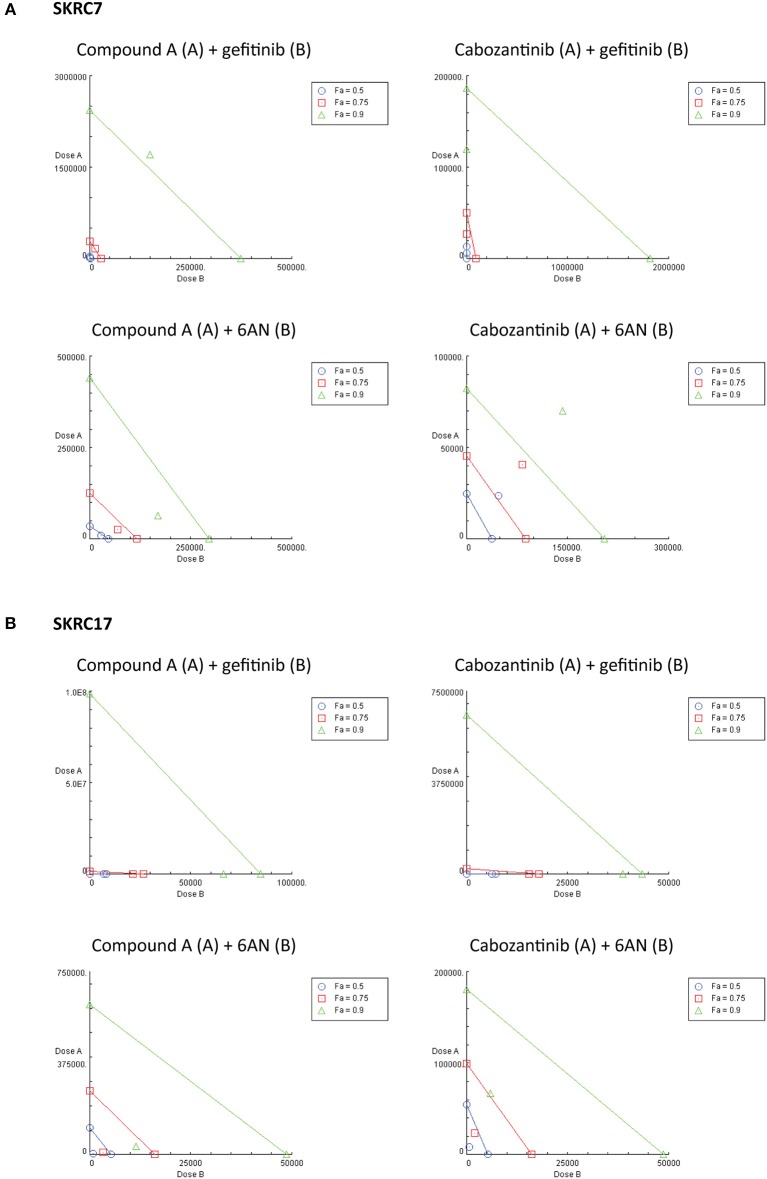
Figure 7.
Combination therapy of MET inhibitors Compound A and cabozantinib with an EGFR inhibitor (gefitinib) or G6PD inhibitor (6AN) in (A) SKRC7 and (B) SKRC17 cell lines. Drug effects were tested using SRB assays. The FA-value represents the fraction of cell viability affected by therapy. Points on the graph axes represent the dose of the monotherapy (drug A or B, as indicated in the figure head of each isobologram) necessary to generate the given FA-value. The line connecting the x- and y-axis represents an additive effect (CI = 1) of the combination at the given FA-value. Points below or above the line represent synergism (CI < 1.0) or antagonism (CI > 1.0), respectively (N = 2).

