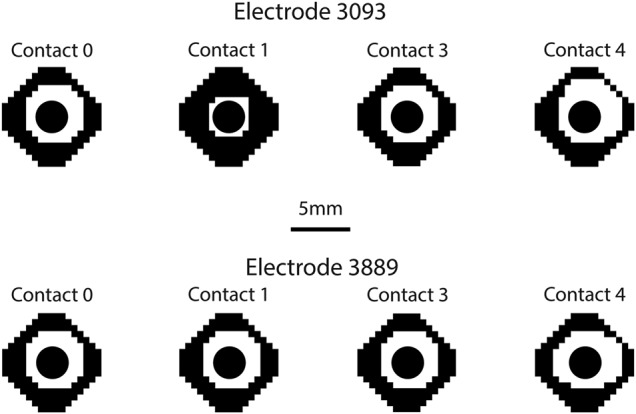
Fig. 6.

VTA plots for all monopolar configurations of both the 3093 and 3889 electrodes. The black region shows the points in space where the fibres did not fire in a 1:1 ratio with the SNS pulses. The white regions are the points where the fibres did fire in a 1:1 ratio
