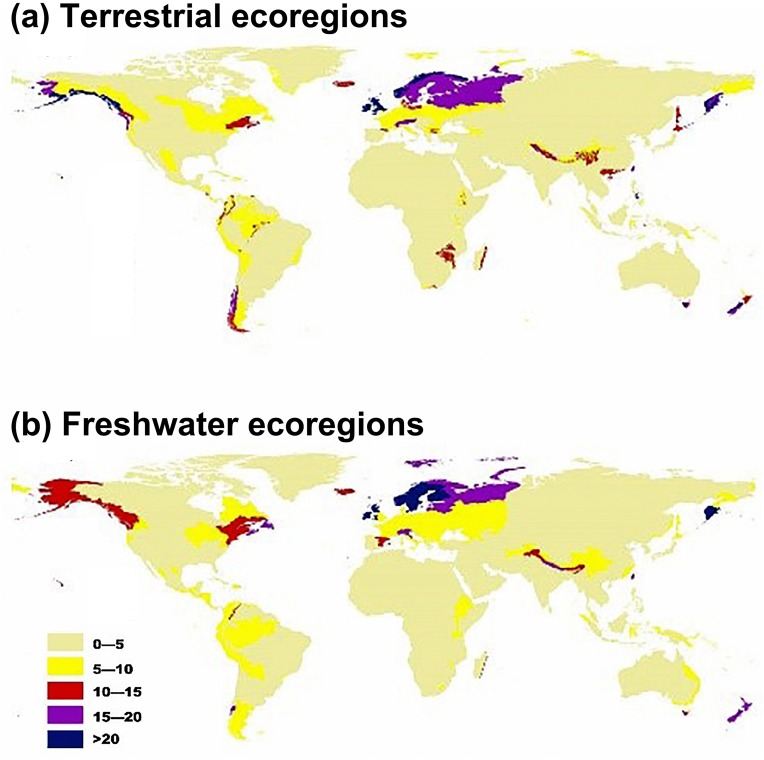
Figure 2. Map showing the potential for invasive plant expansion in RCP 4.5 for terrestrial ecoregions (A) and freshwater ecoregions (B).
The colours coupled with the numbers in this figure represent the level of IPS expansion potential across different ecoregions. Blue means there is a very high chance of expansion and tan-yellow means a low chance of expansion. The ecoregion maps were obtained from the studies of Olson et al. (2001) and Abell et al. (2008).

