
Figure 1.
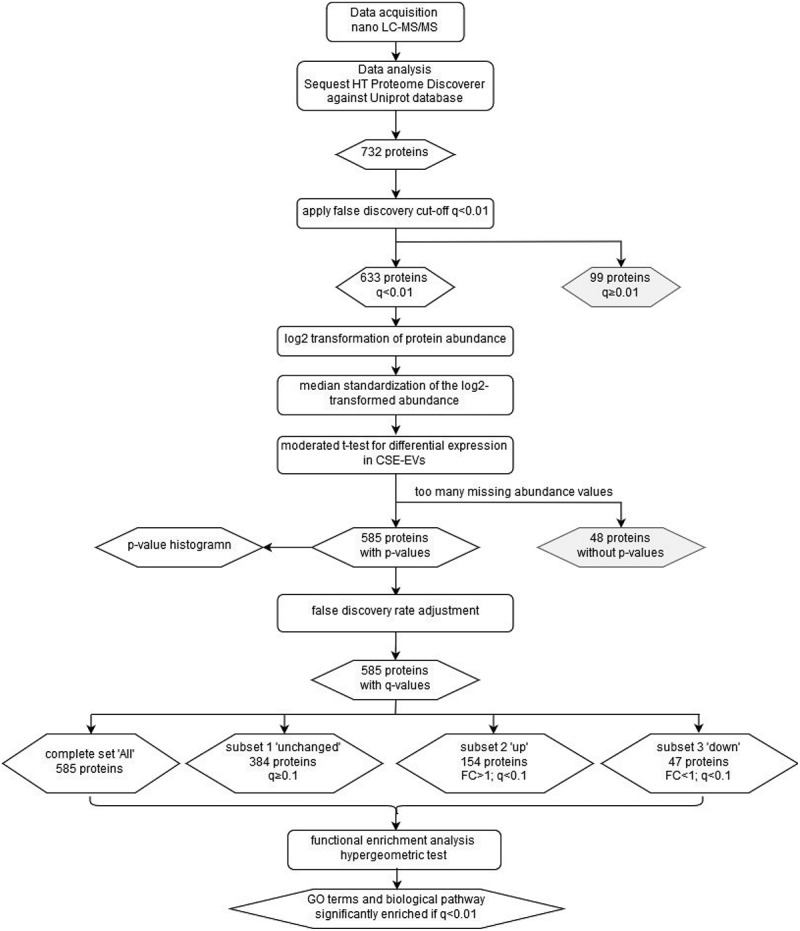
Flow chart of the proteomics data analysis. The chart summarizes the data analysis process starting from the data acquisition and ending at the GO terms and biological pathways that were found to be enriched. Rounded rectangles represent data-handling steps, whereas rhombi represent (intermediate) results. CSE: cigarette smoke extract; EVs: extracellular vesicles; FC: fold-change; GO: gene ontology; LC-MS/MS: liquid chromatography tandem mass spectrometry.