
Figure 3.
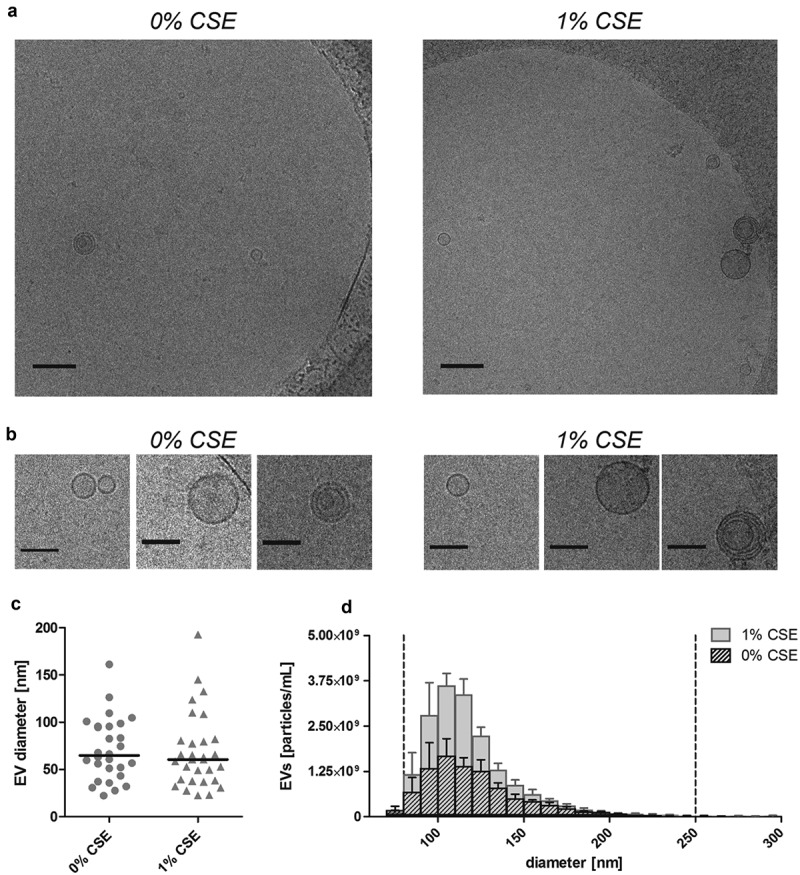
Size and morphology of EVs released by BEAS-2B cells under control conditions and when exposed to 1% (v/v) CSE for 24 h. (a) Low magnification (scale bar 200 nm) and (b) detail (scale bar 100 nm) cryo-TEM recordings of isolated EVs. (c) Diameter of isolated EV as determined by cryo-TEM. (d) Size distribution histogram of isolated EVs as determined by TRPS. Bars show the mean ± SEM, n = 5. The vertical dotted lines indicate the size filter that was applied to quantify EVs in order to normalize the input for EV characterization (80–250 nm). CSE: cigarette smoke extract.