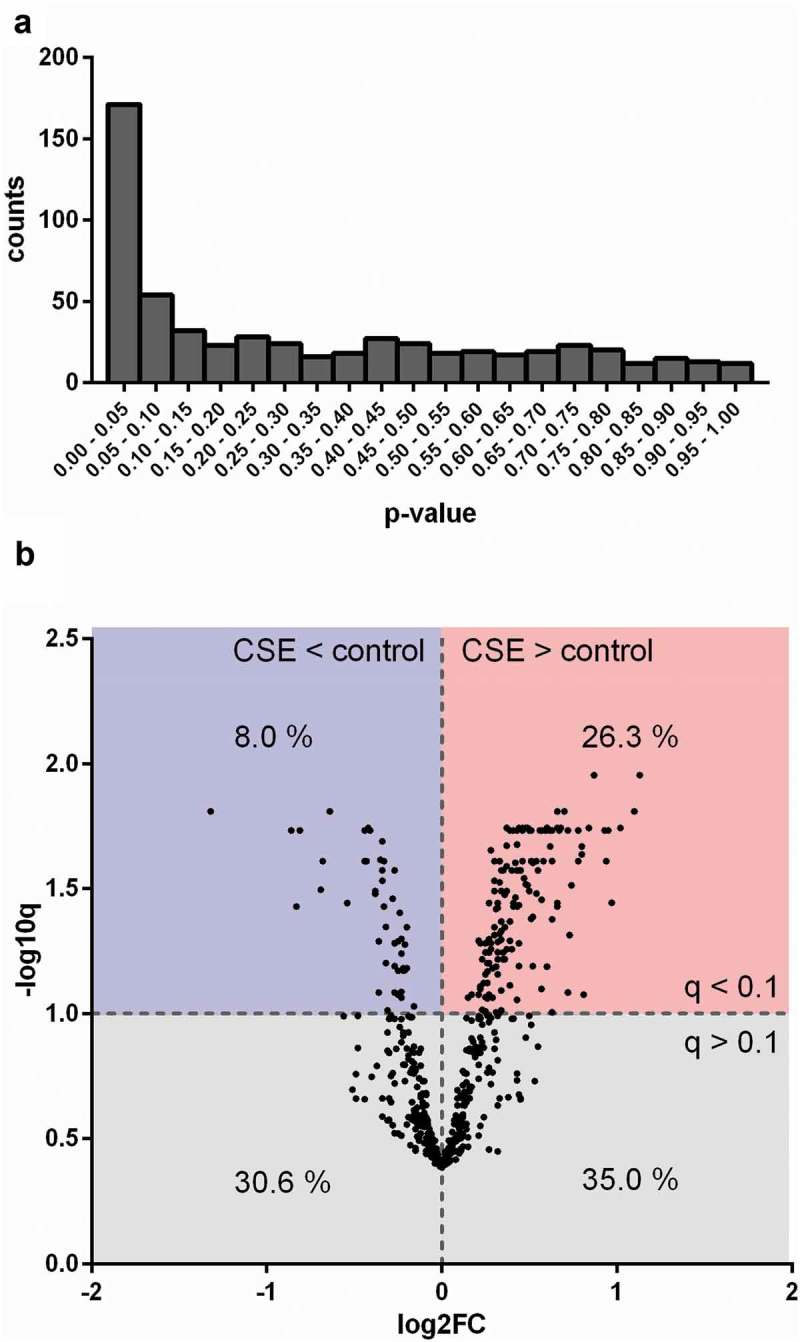
Figure 4.

Differences in protein composition of EVs from unexposed or CSE-exposed BEAS-2B cells. (a) Histogram of p-values obtained by performing a moderated t-test to detect differences between control-EVs and CSE-EVs concerning the expression of proteins identified by nano-LC-MS/MS, n = 5. (b) Volcano plot. The x-axis shows the log2 of the fold change (expression in CSE-EVs/expression in control-EVs) and the y-axis shows the −log10 of the q-value. CSE: cigarette smoke extract.
