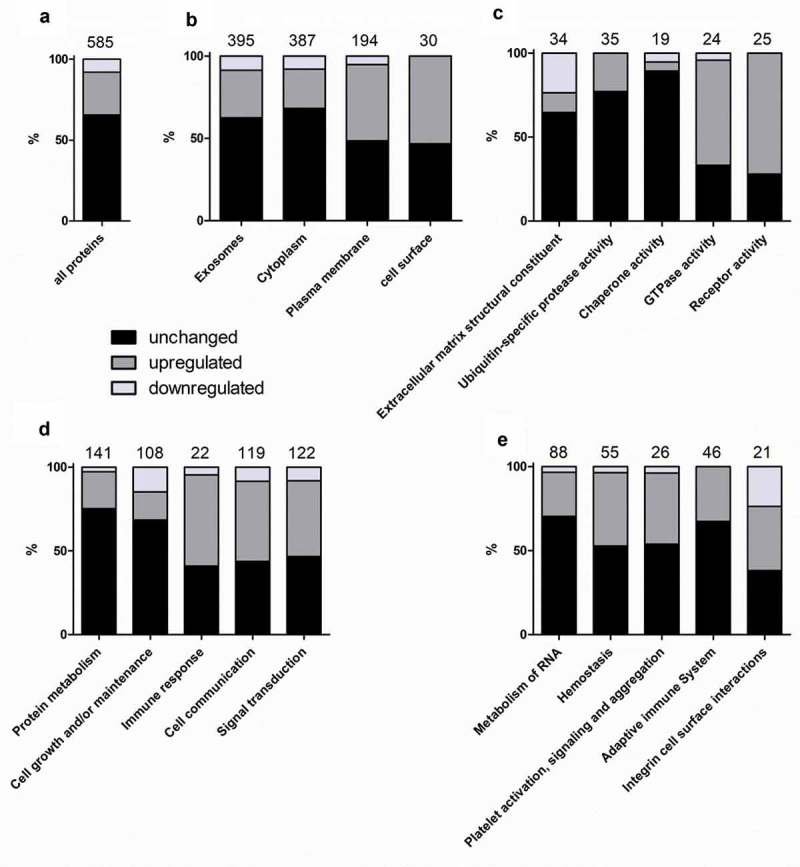
Figure 5.

Results of the functional enrichment analysis. The graphs display how many percent of the proteins related to the analysed GO terms or pathways were unchanged, up-regulated or down-regulated in the CSE-EVs compared to control-EVs. Panel (a) shows a reference bar with the percentages of unchanged, up-regulated and down-regulated proteins for all 585 proteins included in the functional enrichment analysis. (B–E) show the percentages of proteins related to different cellular components (b), molecular functions (c), biological processes (d) or biological pathways (e) that were unchanged, up-regulated or down-regulated in CSE-EVs compared to control-EVs. The numbers above the bars indicate the total number of proteins identified for each GO term or pathway.
