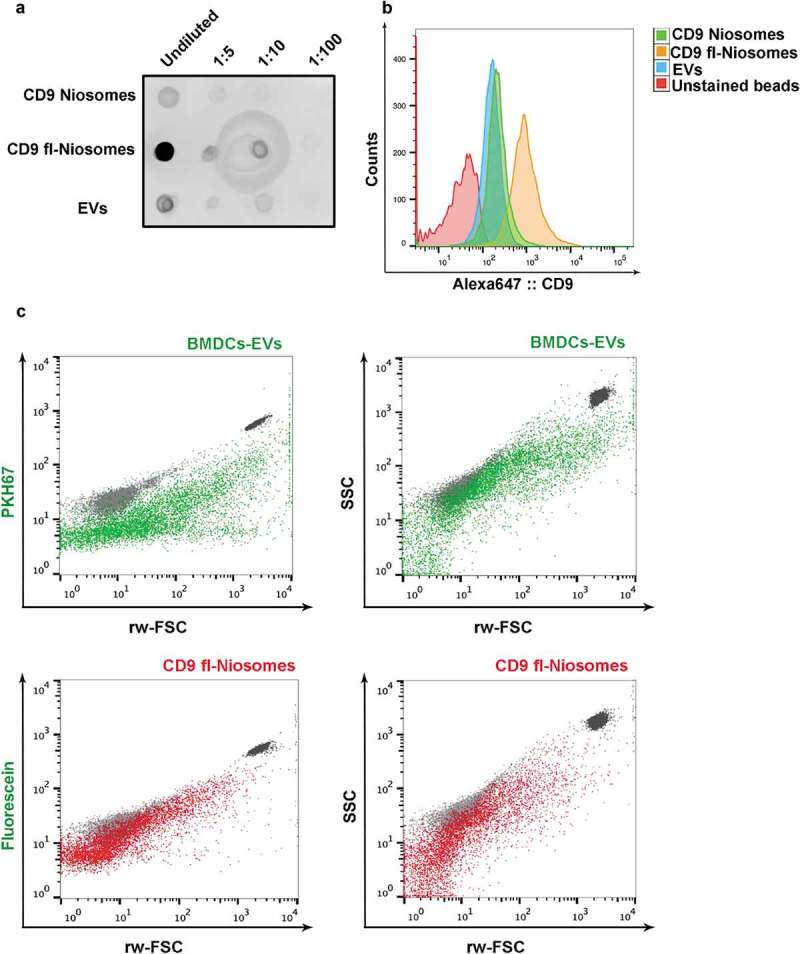
Figure 6.

Side by side comparison of CD9-decorated niosomes and natural EVs. (a) Dot blot analysis of serial dilutions of CD9-niosomes, CD9-fluorescent niosomes and EVs isolated by SEC from MCF7 conditioned media. Number of particles were previously matched by NTA quantification of the three samples. (b) Bead-assisted flow cytometry of CD9-decorated niosomes and EVs isolated from MCF7 cell culture supernatant. Upon capture, beads were incubated with anti-CD9 VJ1/20 mAb and stained with secondary anti-mouse-Alexa 647. Negative control corresponds to beads coated with EVs in the absence of primary antibody. (c) High-resolution flow cytometry. Dot plots of fluorescence vs. reduced wide-angle FSC (rw-FSC) or SSC vs. rw-FSC of EVs from DC conditioned medium (green) or CD9-decorated fluorescent niosomes (red). As a reference 200 nm and 100 nm yellow-green fluorescent (505/515) FluoSphere Carboxylate-Modified Microspheres (ThermoFisher) are plotted alongside (light and dark grey populations, respectively).
