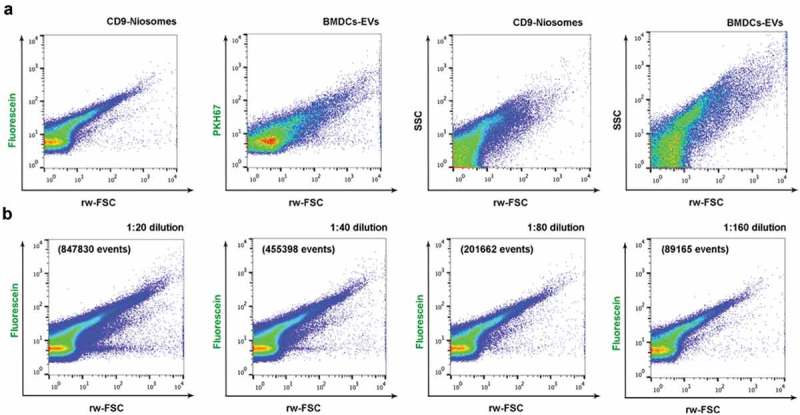
Figure 7.

High-resolution flow cytometric analysis of decorated fluorescent niosomes. (a) Dot plots displaying fluorescence from fluorescein or PKH67 vs. reduced wide-angle FSC (rw-FSC) and SSC vs. rw-FSC of fluorescein containing CD9-niosomes and mouse BMDC-derived PKH67-stained EVs. (b) Serial dilutions of the CD9-niosome sample were analysed. Fluorescence vs. rw-FCS dot plots for serial dilutions (1:20, 1:40, 1:80, 1:160 from left to right) are shown. Number of events for each dilution plot are indicated. Plots are representative for n = 3.
