Fig. 2.

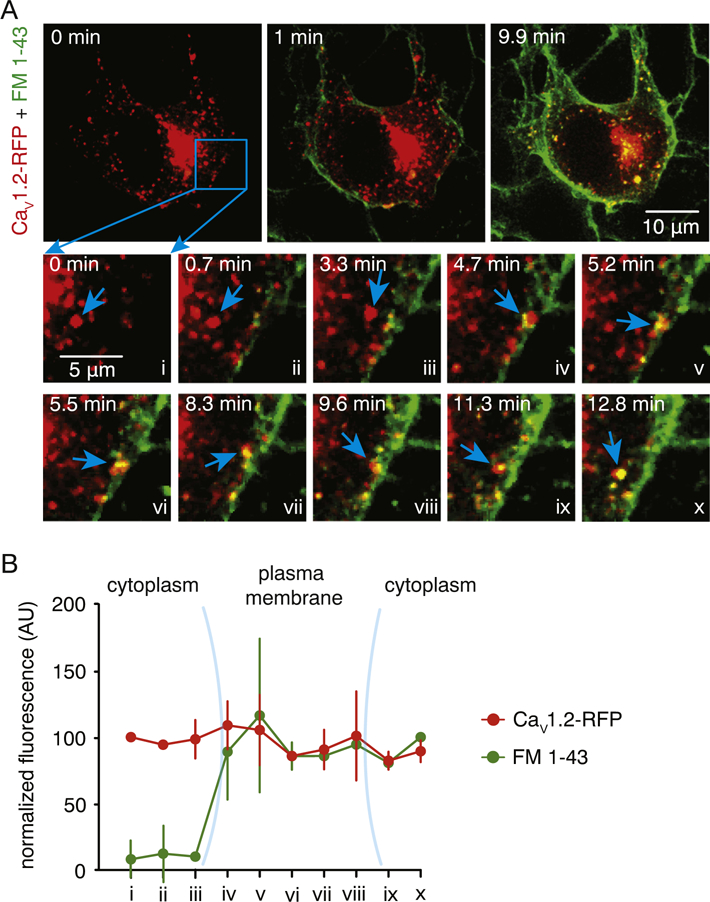
Interaction of CaV1.2 structures with plasma membrane. A) Representative dual-color spinning-disk 3D images of a vehicle-treated tsA-201 cell expressing CaV1.2-RFP before (0 min) and after (1 and 9.9 min) application of fluorescent plasma membrane dye FM 1–43 dye. Lower panels depict enlarged time lapse illustrations of the area highlighted by the blue square. The blue arrows point to a CaV1.2 structure that approaches the plasma membrane, then uptakes the FM 1–43 dye and moves to the interior of the cell. B) Normalized FM 1–43 (green) and CaV1.2 (red) fluorescence intensity (AU) of CaV1.2 structure highlighted by the blue arrowhead in panel A over time. Data are shown as mean ± SEM (n = 6 cells).
