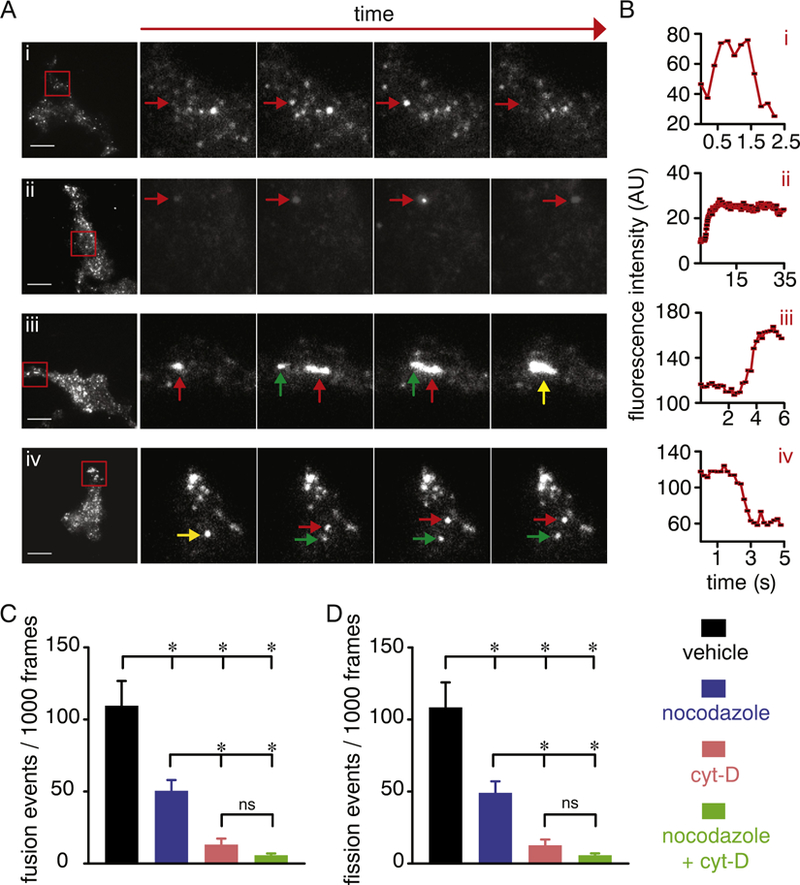
Fig. 5.

Distinct cytoskeleton-dependent perimembrane behavior of CaV1.2 vesicles. A) Exemplary TIRFM and enlarged time-lapse images of the area highlighted by the red squares in the images on the left side panels showing distinct mobility patterns of CaV1.2-RFP in vehicle-treated tsA-201 cells. Arrows in each image point to the tracking of specific vesicles and their behavior, including “kiss-and-run” (Ai; red arrow), “kiss-and-stay/linger” (Aii; red arrow), “merge-and-linger” (homotypic fusion event; red and green arrows highlight two different vesicles, and the yellow arrow points to fusion of vesicles; Aiii) and “break-and-run” (homotypic fission; yellow arrow highlights a vesicle splitting in two distinct ones highlighted by the red and green arrows; Aiv). Scale bar = 10 μm. B) Time course of mean fluorescence intensity (AU) of CaV1.2 vesicles highlighted by the red arrows in panel A. Bar plots of the frequency of resolvable homotypic fusion (C) and fission (D) events of CaV1.2 vesicles in vehicle-treated (n = 17 cells), 10 μM nocodazole (C; n = 13 cells), 10 μM cytocholasin-D (D; n = 10 cells) or 10 μM nocodazole + cytocholasin-D (E; n = 17 cells) -treated cells. Data are shown as mean ± SEM. *P < 0.05. Kruskal–Wallis test. Significance was compared between data as specified.
