Fig. 7.

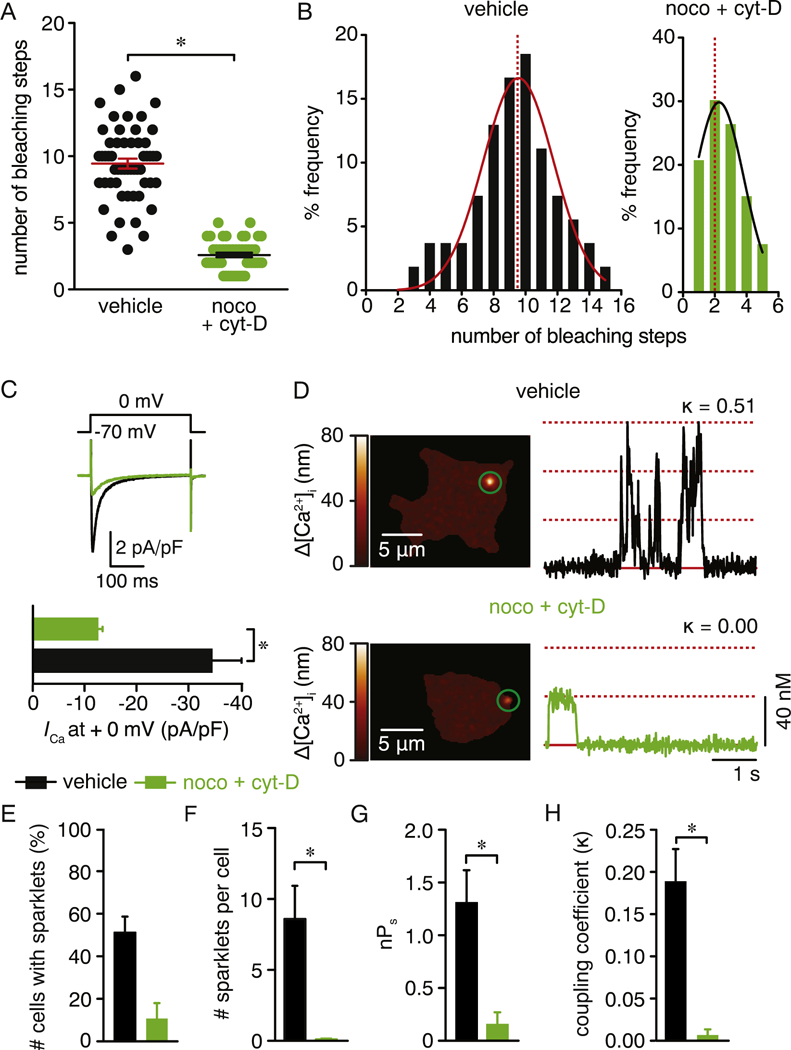
Depolymerization of the cytoskeleton reduces CaV1.2 clustering, channel activity and cooperative gating. A) Scatter plot of the number of bleaching steps obtained from vehicle (n = 54 spots, from 5 cells) and nocodazole + cytocholasin-D (n = 53 spots, from 5 cells) treated cells. Data are shown as mean ± SEM. *P < 0.05. Mann-Whitney test. Significance was compared between data as specified. B) Frequency distribution of bleaching steps between vehicle or nocodazole + cytocholasin-D -treated cells. Histograms were fit using a single Gaussian curve (black lines). The dotted red lines denote the median of the distribution (9 for vehicle-treated cells and 2 for noco + cyt-D-treated cells). C) Representative ICa recording from tsA-201 cells expressing CaV1.2-RFP that were treated with vehicle or 10 μM nocodazole + cytocholasin-D. ICa were evoked by 300 ms depolarization step from a holding potential of −70 mV to 0 mV. Bar plots immediately below summarize the mean ± SEM of the ICa current density at 0 mV. D) Representative TIRFM images showing Ca2+ sparklets in cells expressing CaV1.2-RFP that were treated with either vehicle (upper panel) or 10 μM nocodazole + cytocholasin-D (lower panel). Traces at the right of each image show the time course of [Ca2+]i in the respective green circles. k represents the coupling coefficient for each trace. Bar plots showing (E) number of cells with CaV1.2 sparklets, (F) number of CaV1.2 sparklet sites per cell, (G) CaV1.2 sparklet activity and (H) coupling coefficient (k) for CaV1.2 sparklets in vehicle (n = 47 cells) or 10 μM nocodazole + cytocholasin- D (n = 19 cells) -treated cells. Data are shown as mean ± SEM. *P < 0.05. Mann Whitney test. Significance was compared between data as specified.
