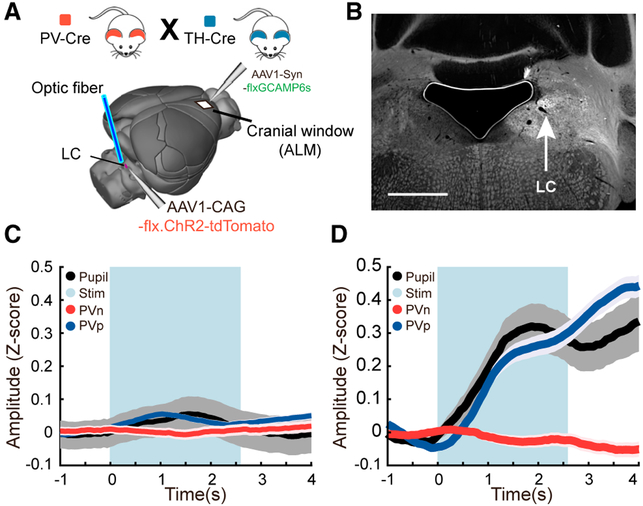
Figure 3. Direct Optogenetic Stimulation of the LC.
(A) Schematic showing the placement of a fiberoptic cannula into the brain to stimulate the LC as well as the position of the imaging window in the ALM
(B) An example image showing the fluorescence of tdTomato-tagged Channelrhodopsin-2 following adeno-associated virus (AAV) delivery of a flexed construct into Th-Cre mice. Because ChR2 is membrane-bound, the LC and its axonal projections are labeled. The location of the cell bodies in the LC is shown by the arrow. The black region to the left is an air bubble over the ventricle. The tissue above and to the right of this is the cerebellum. Scale bar, 1 mm.
(C) Control mice; time series measures of pupil diameter and PVp and PVn cells imaged in the ALM during optical stimulation of the LC. The blue bar delineates the time during which stimulus pulses were given. Plots are mean and SEM. n = 103 trials in 3 mice representing 104 PVp and 69 PVn cells in 7 fields of view; rank-sum test comparing the means of the response prior to the tone and during the tone: PVp, p = 0.057; PVn, p = 0.39.
(D) Experimental mice; time series as (C). Note the increase in pupil diameter and PVp responses upon LC stimulation. n = 116 trials in 2 mice representing 86 PVp cells and 72 PVn cells imaged in 7 fields of view; rank-sum test comparing the means of the response prior to the tone and during the tone: PVp, p = 2.3e–18; PVn, p = 0.24.

