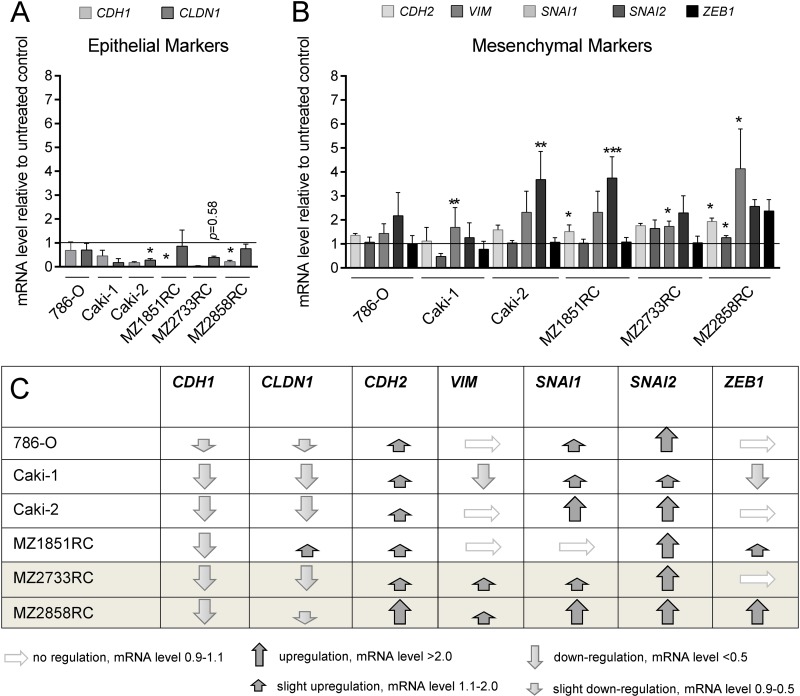
Figure 3. TGF-β1 treatment stimulates EMT in RCCs.
All bar graphs show mRNA levels determined by qPCR relative to the unstimulated control and represent mean values of at least 3 biological replicates (n ≥ 3). (A) The epithelial markers CDH1 and CLDN1 were reduced after TGF-β1 treatment in all RCC cell lines tested. (B) In general, mesenchymal markers were either not regulated or upregulated after TGF-β1 treatment in six different RCC cell lines. For Caki-1, a down-regulation of VIM and ZEB1 was observed. (C) Table summarizing the regulation of epithelial and mesenchymal marker expression in seven different RCC cell lines. Grey shaded rows indicate the ccRCC (MZ2733RC) and the pRCC cell line (MZ2858RC) responding best to the TGF-β1 treatment. (*p ≤ 0.05, **p ≤ 0.01, ***p ≤ 0.001).

