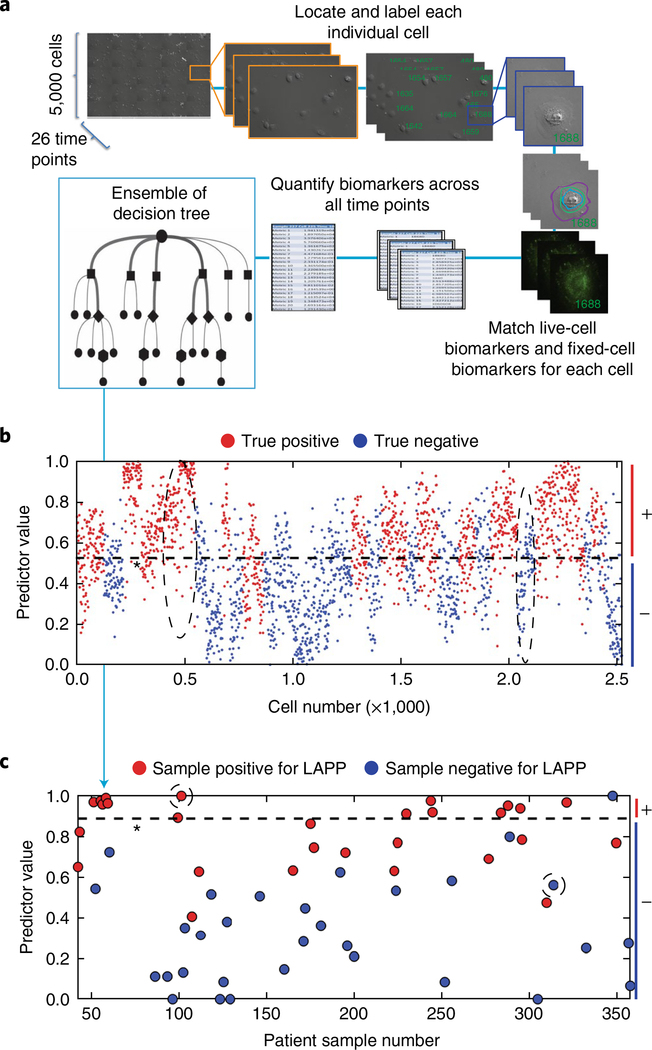
Fig. 3 |. Quantification of automated machine-vision biomarkers informs random-forest decision trees for the stratification of single cells and the prediction of surgical pathology features.
a, Live-cell images were collected on approximately 5,000 cells across 26 time points. Cells were fixed and stained and a 27th image was taken. Each cell was assigned a unique identifier and measured for respective live-cell and fixed-cell cellular and molecular phenotypic biomarkers, leading to an average of 42 million measurements per sample. These measurements were consolidated across time points to ~328 measurements per cell. The set of biomarkers measured for each cell were fed to a statistical-analysis algorithm that generates multiple decision trees to stratify negative cells and positive cells for a given pathological outcome. Decision trees were weighted to optimize algorithm accuracy. b, Characterization of individual normal and potiential cancer cells. A representative plot showing the stratification of negative cells and positive cells through combinations of biomarkers determined by random-forest decision tree analysis. Patient-level results were obtained by summarizing the cell-level results. c, Stratification and prediction of whether patients are positive or negative for surgical adverse pathological features of interest. A representative plot shows the stratification of patients for a given predicted pathology feature. Dashed ovals in b show groups of cells predicted as true positives and true negatives for LAPP, and correspond to the circled patient-level predictions in c. Dashed lines indicate the machine-learning-derived thresholds for the discrimination of negative (−) and positive (+ ) cells (b) and patients (c).

