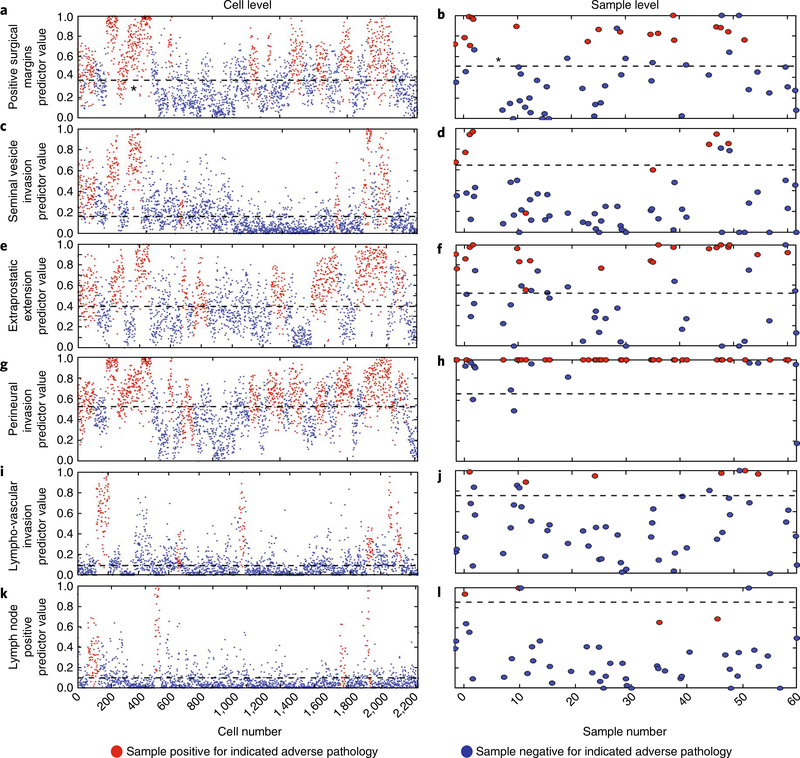
Fig. 4 |. Machine-learning statistical algorithms predict specific surgical adverse-pathology features in blinded test-sample sets.
a, A cell-level plot stratifying negative (blue circles) and positive (red circles) cells for PSMs. The black dashed line indicates the threshold, determined by machine-learning-derived statistical algorithms. b, Corresponding patient-level plot stratifying positive (red circles) and negative (blue circles) for PSMs. Results were obtained by summarizing the cell-level results. The black dashed line indicates the threshold set by the machine-learning-derived statistical algorithm. c–l, Cell-level plots stratifying negative and positive cells for SVI (c), EPE (e), PNI (g), LVI (i) and LNP (k), and patient-level plots stratifying patients for SVI (d), EPE (f), PNI (h), LVI (j) and LNP (l).

