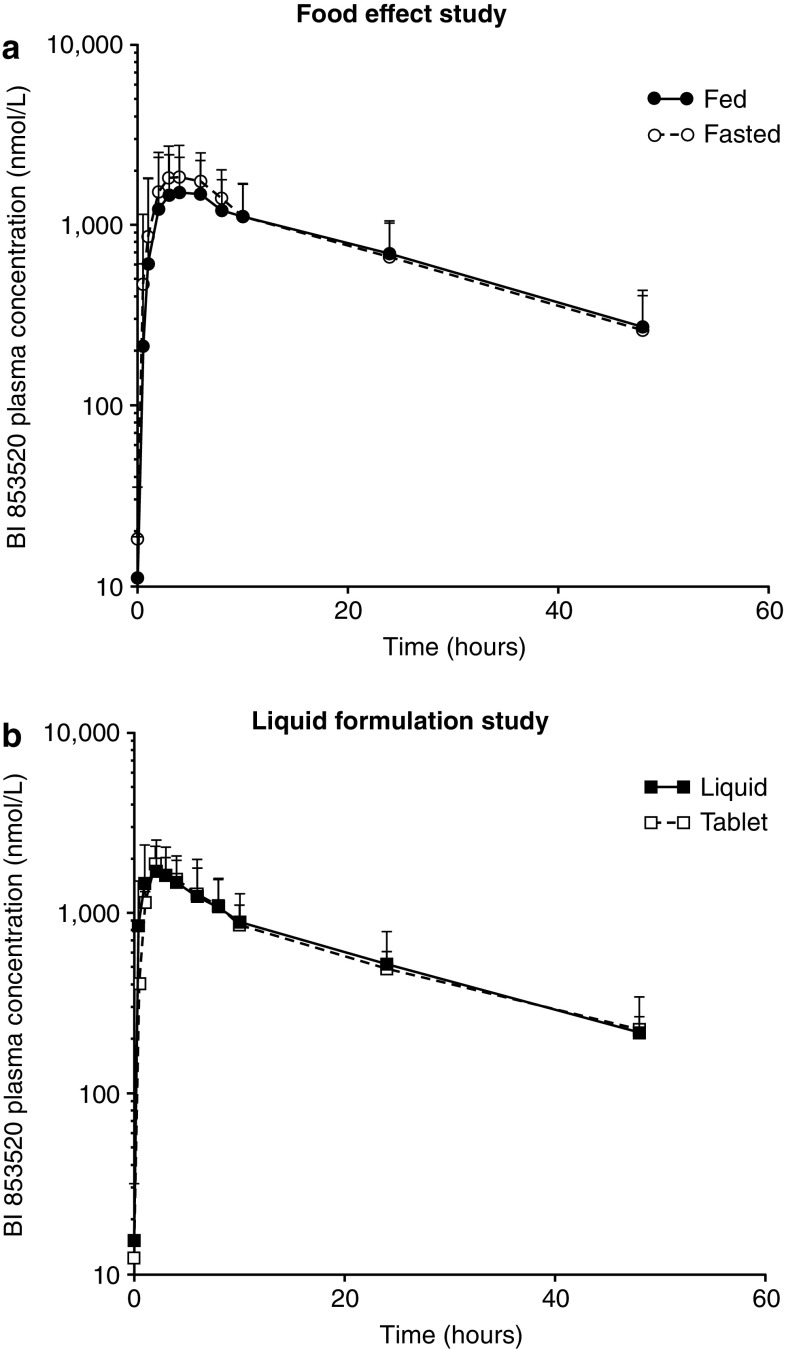
Fig. 2.
Plasma concentration–time curves for BI 853520 (200 mg) in the food-effect and liquid formulation studies. Mean plus standard deviation of the plasma concentration–time curves for a 200 mg BI 853520 tablet administered to patients in a fed and fasted state (a) and a 200 mg dose of BI 853520 administered as a liquid dispersion and tablet (b)

