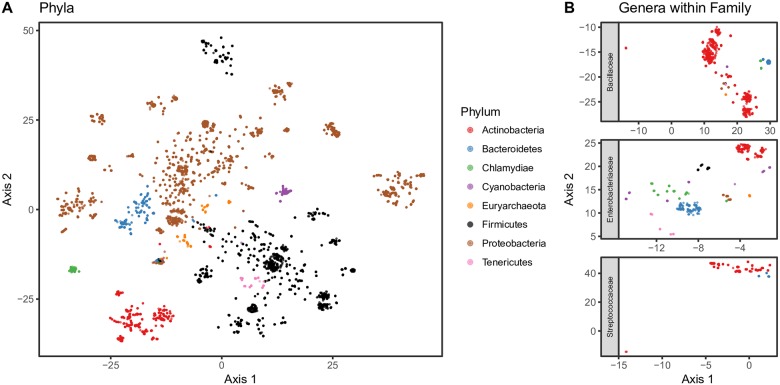
Fig 1. t-SNE projection of sequence embeddings from KEGG 16S sequences.
Embedding results were generated using 256 dimensional embeddings of 10-mers that were denoised. A: 2-dimensional projection via t-SNE of the sequence embedding space from 14,520 KEGG 16S sequences. The position of each sequence (points) are colored based on their phylum designation. B: t-SNE projection of sequences that belong to different genera within the same family.

