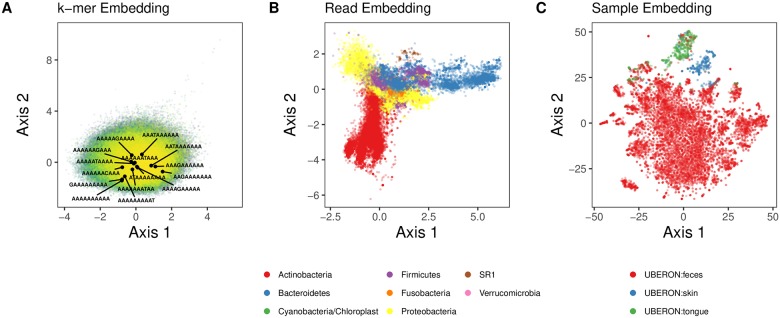
Fig 5. Lower dimensional projections of k-mer, sequence, and sample embeddings.
Embedding results were generated using 256 dimensional embeddings of 10-mers that were denoised. A: A 2-dimensional projection via independent component analysis of the 10-mer embedding space from the GreenGenes training sequences. 406,922 unique 10-mers are shown. The position of 10-mers that differ by one nucleotide from AAAAAAAAAA are labeled to demonstrate that it is not simply sequence similarity that is preserved, since these sequences span a wide range in the embedding space. The k-mers were sorted alphabetically and ranked; the alphabetical progression of the indexes are shaded from yellow to green. B: A 2-dimensional projection via independent component analysis. 705,598 total sequences embeddings from 21 randomly chosen American Gut samples (7 from each class) are shown. The position of each sequence (points) is colored based on its phylum designation (only the 7 most abundant phyla are shown). C: 2-dimensional t-SNE projection of the 11,341 American Gut sample embeddings. The position of each sample (points) is colored based on its body site label.

